
Image
|
Figure Caption
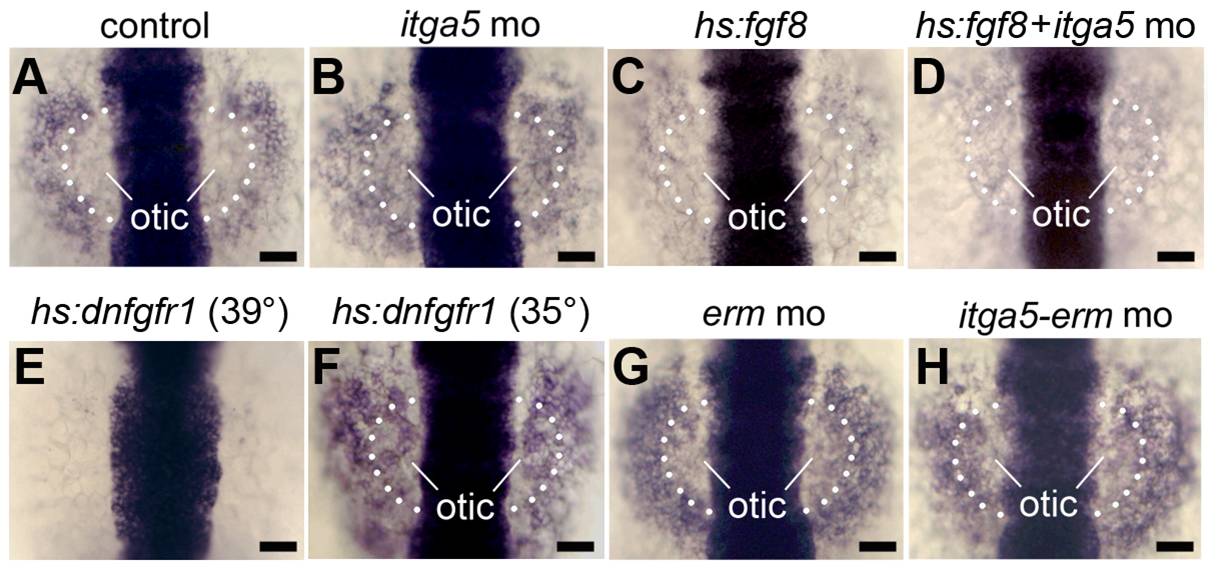
Fig. 7 Similar effects of Itga5 and Fgf on sox3 expression.
(A–H) sox3 expression at 12.5 hpf in a control embryo (A), itga5 morphant (B), Tg(hs:fgf8/+) heat shocked at 37°C alone (C) or with itga5 morpholino (D), Tg(hs:dnfgfr1/+) heat shocked at 39°C (E) or 35°C (F), erm morphant (G) and itga5-erm double morphant (H). The otic region where sox3 normally downregulates is indicated. Scale bar, 50 μm.
Acknowledgments
This image is the copyrighted work of the attributed author or publisher, and
ZFIN has permission only to display this image to its users.
Additional permissions should be obtained from the applicable author or publisher of the image.
Full text @ PLoS One