
Fig. 3
- ID
- ZDB-IMAGE-151019-15
- Genes
- Publication
- Sztal et al., 2015 - Zebrafish models for nemaline myopathy reveal a spectrum of nemaline bodies contributing to reduced muscle function
- All Figures
- Figures for Sztal et al., 2015
|
Fig. 3
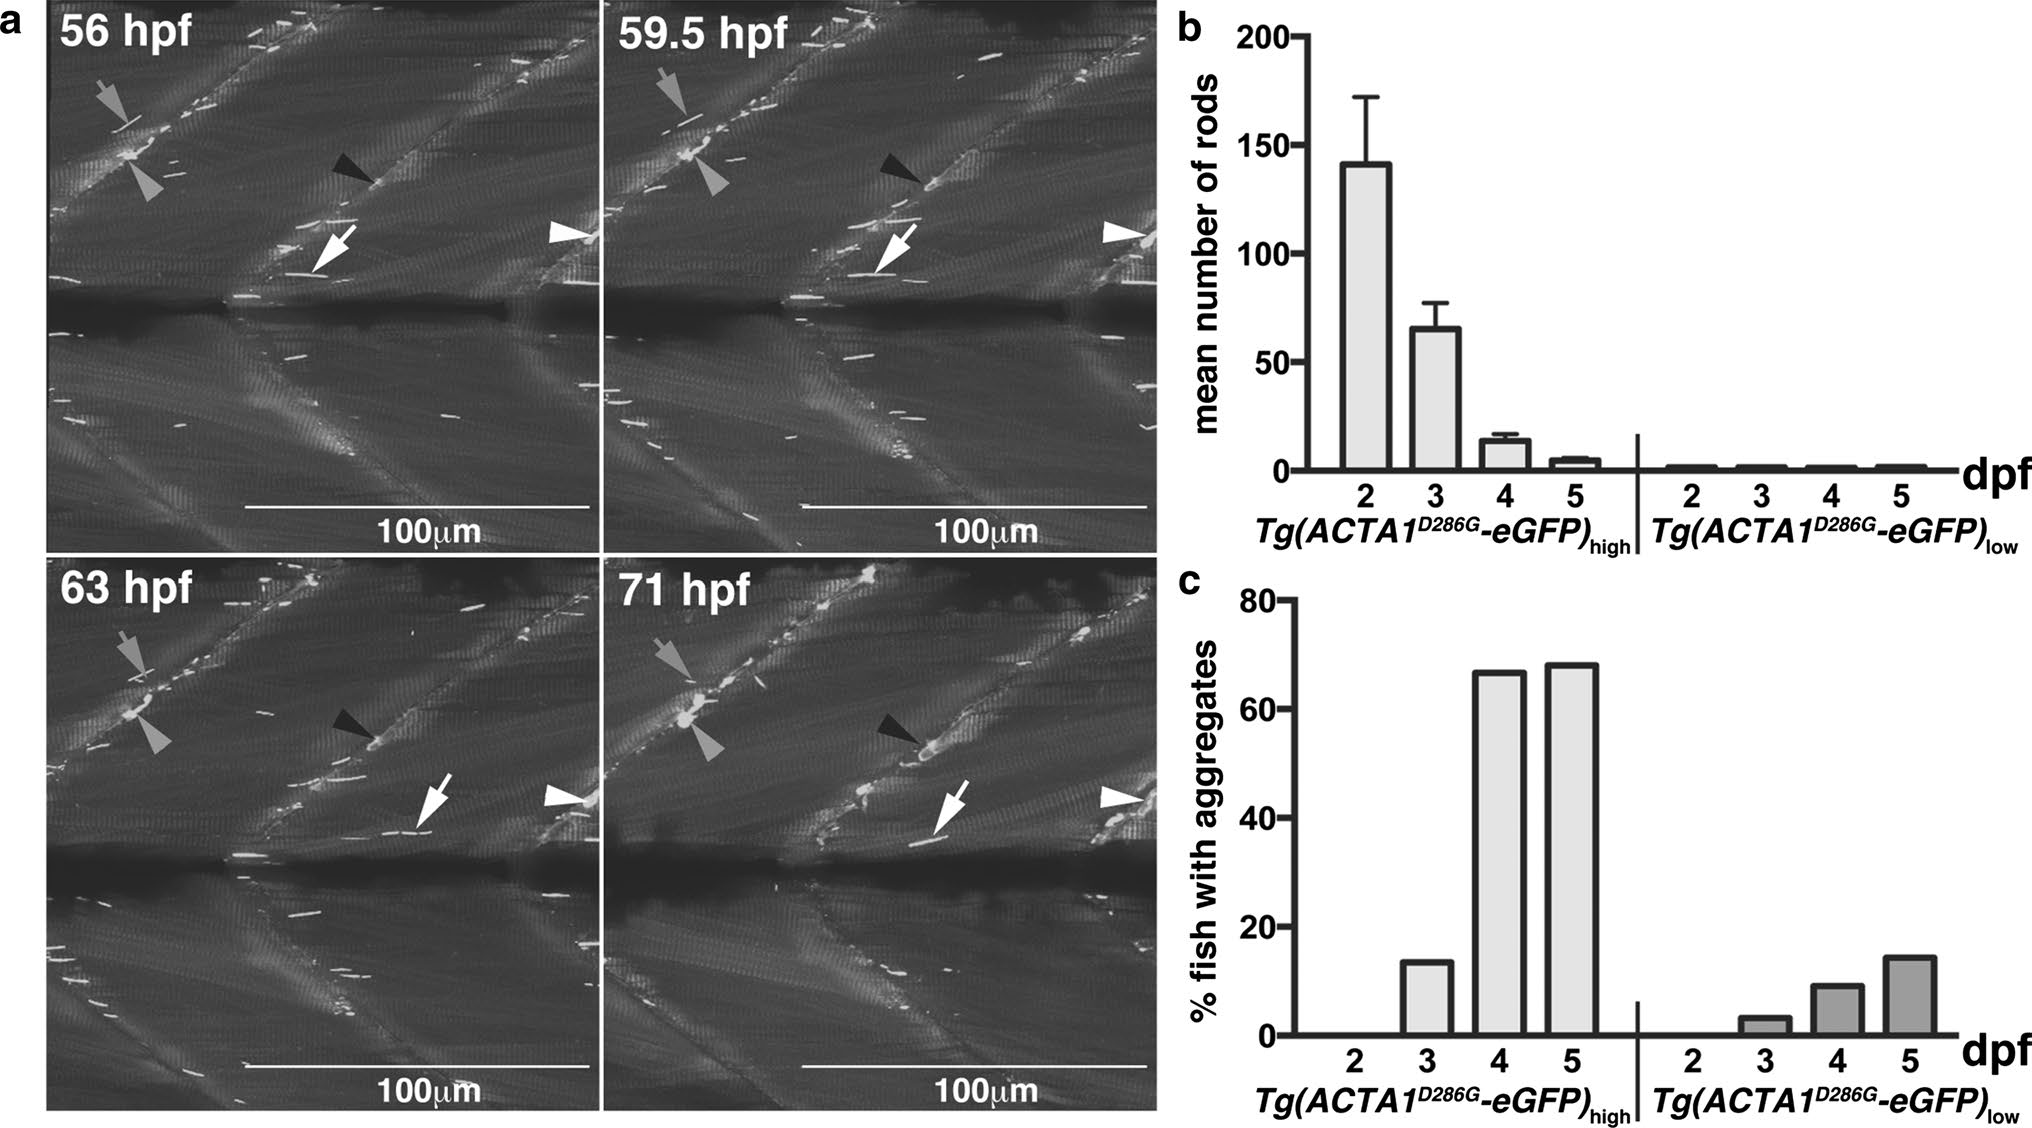
Formation of nemaline bodies and aggregates in Tg(ACTA1 D286G-eGFP)high zebrafish. a Maximum projection images from time lapse of Tg(ACTA1D286G-eGFP)high fish from 56 to 71 hpf showing nemaline bodies distributed throughout the skeletal muscle (arrows). Nemaline bodies’ fragment from 59.5 hpf (arrows), coincident with the formation of aggregates at the myosepta (arrowheads). b Quantification of the mean number of nemaline bodies in Tg(ACTA1 D286G-eGFP) low (n = 50 per stage) and Tg(ACTA1 D286G-eGFP) (n = 48 per stage) strains. c Quantification of the percentage of fish displaying globular aggregates in Tg(ACTA1 D286G-eGFP) low and Tg(ACTA1 D286G-eGFP) high strains (n = 50 per stage). Error bars represent SEM from three independent experiments (n = 45 per replicate)