
Image
|
Figure Caption
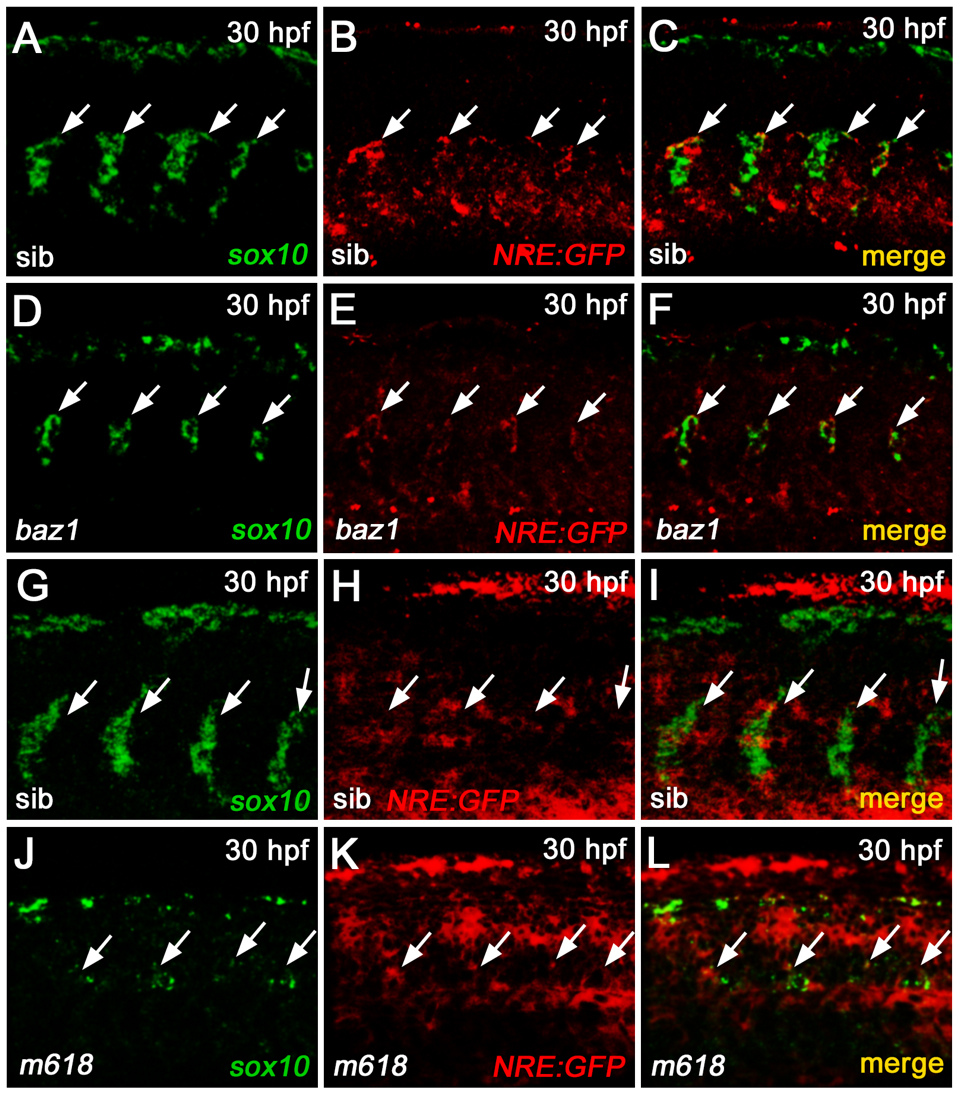
Fig. S7
Transcriptional analysis of Notch reporter expression in sox10 mutants.
A-F) fluorescent WISH analysis in baz1 and WT sib shows a decrease of sox10 and Notch reporter transcription in the DRG regions (arrows) of the mutant (D-F), compared to the control (A-C). G-L) fluorescent WISH analysis in m618 and WT sib shows a decrease of sox10 and persistency of Notch reporter transcription in the DRG regions (arrows) of the mutant (J-L), compared to the control (G-I). All panels display embryonic trunk regions at 30 hpf, in lateral view with anterior to the left.
Acknowledgments
This image is the copyrighted work of the attributed author or publisher, and
ZFIN has permission only to display this image to its users.
Additional permissions should be obtained from the applicable author or publisher of the image.
Full text @ PLoS One