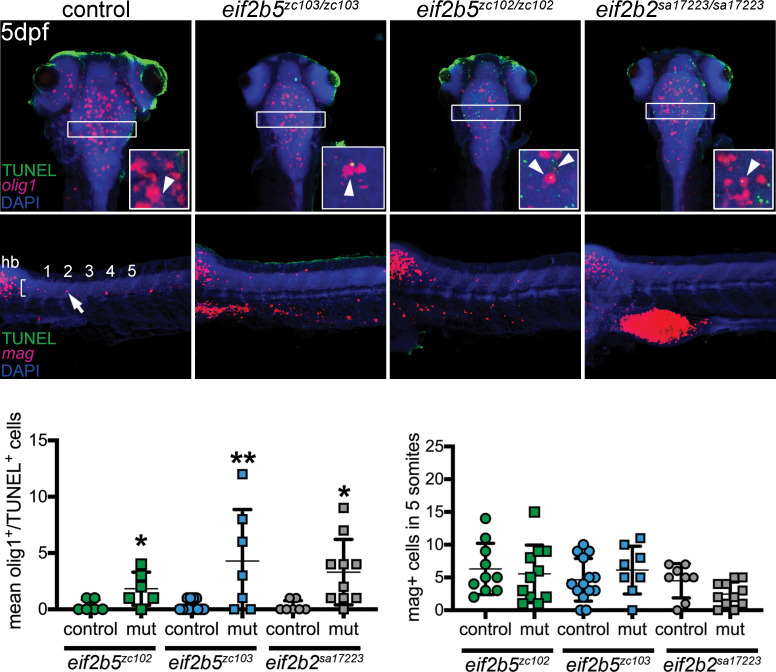
Figure 4 Top row (and quantification in lower left): increased apoptotic OPCs in the brain and spinal cord. Confocal images of brain, z-stack, rostral to the top, double-labeling for TUNEL and olig1 (in situ probe), in WT, eif2b5zc103/zc103, eif2b5zc102/zc102 or eif2b2sa17223/sa172233 larvae. Region used for quantification shown by box. Inset in each panel shows example of double-labeled cell (TUNEL, olig1) for each genotype (except WT), single confocal slice image. Middle panels: no change in apoptosis of differentiated oligodendrocytes, co-labeled with myelin associated glycoprotein (mag) (in situ probe) and TUNEL. Confocal z-stack images of spinal cord, rostral to the left; quantified in lower right panel.
                
                    
                        Image


                        Figure Caption


                        Figure Data


                        Acknowledgments


This image is the copyrighted work of the attributed author or publisher, and
ZFIN has permission only to display this image to its users.
Additional permissions should be obtained from the applicable author or publisher of the image.
      Full text @ Elife