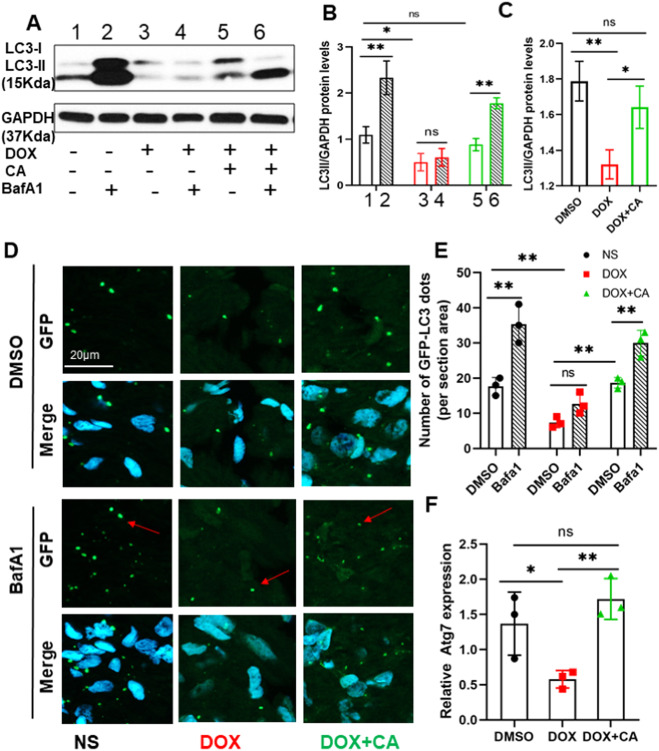
Fig. 3 Effect of CA on autophagy in adult zebrafish DIC model. (A) Representative western blot showing changes in LC3II protein levels in the heart after DOX and CA treatment. Baflomycin A1 (30 nM) was administered 4 h before sacrifice the fish to assess autophagic flux changes. (B, C) Quantification of relative amounts of LC3II. n = 3 hearts per group on each time point. Bars represent mean ± SD. (D, E) Representative images and quantification of sectioned ventricles of Tg(GFP-Lc3) fish at 56 dpi with or without BafA1 treatment. Arrows: Lc3 aggregating dots formed during autophagy. (F) Relative RNA expression degree of atg7 in indicated group. *P < 0.05, **P < 0.01.
                
                    
                        Image


                        Figure Caption


                        Figure Data


                        Acknowledgments


This image is the copyrighted work of the attributed author or publisher, and
ZFIN has permission only to display this image to its users.
Additional permissions should be obtained from the applicable author or publisher of the image.
      Full text @ Biomed. Pharmacother.