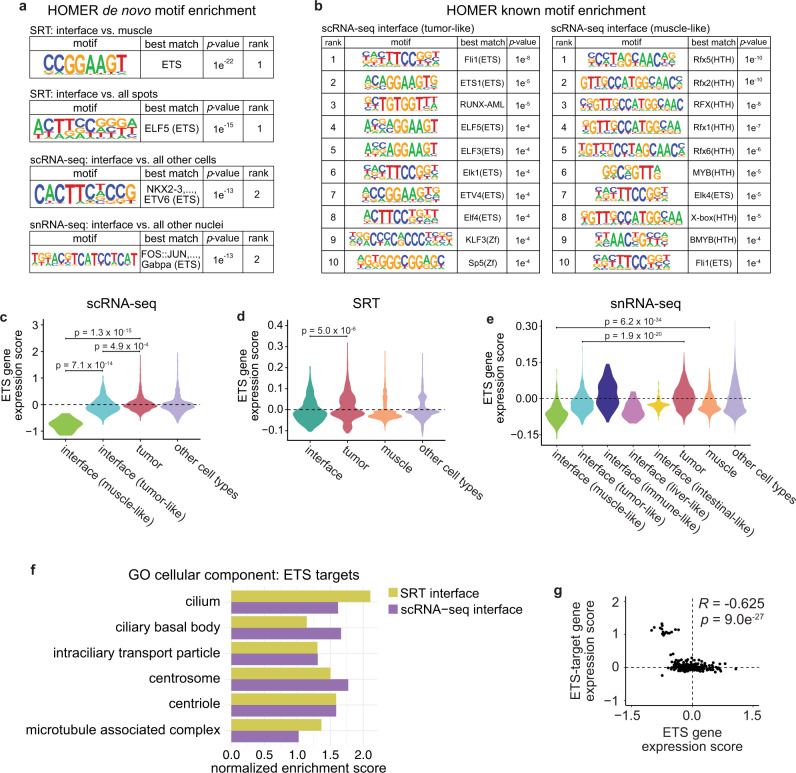
ETS transcription factors may regulate cilia gene expression at the interface.
a Results from HOMER de novo motif analysis of differentially expressed genes in the SRT, scRNA-seq, and snRNA-seq interface clusters. b Top ten enriched motifs from HOMER known motif analysis of the scRNA-seq tumor-like (left) and muscle-like (right) interface cell states. a, bp-values calculated using the hypergeometric test (one-tailed). c–e Relative expression of zebrafish ETS genes across the clusters in the scRNA-seq (c), SRT (d), and snRNA-seq (e) datasets. p-values are noted (Wilcoxon rank sum test, two-sided, with Bonferroni’s correction). f Normalized enrichment score of cilia-related pathways enriched in ETS-target genes within the SRT and scRNA-seq interface clusters. g Scatter plot comparing ETS gene expression scores per cell and ETS-target gene expression scores per cell in the scRNA-seq interface cluster. Pearson’s correlation coefficient (R) and p-value of correlation (two-sided) is indicated.
This image is the copyrighted work of the attributed author or publisher, and
ZFIN has permission only to display this image to its users.
Additional permissions should be obtained from the applicable author or publisher of the image.
Full text @ Nat. Commun.
Your Input Welcome
Thank you for submitting comments. Your input has been emailed to ZFIN curators who may contact you if
additional information is required.
Oops. Something went wrong. Please try again later.