Image


                        Figure Caption


Figure 2
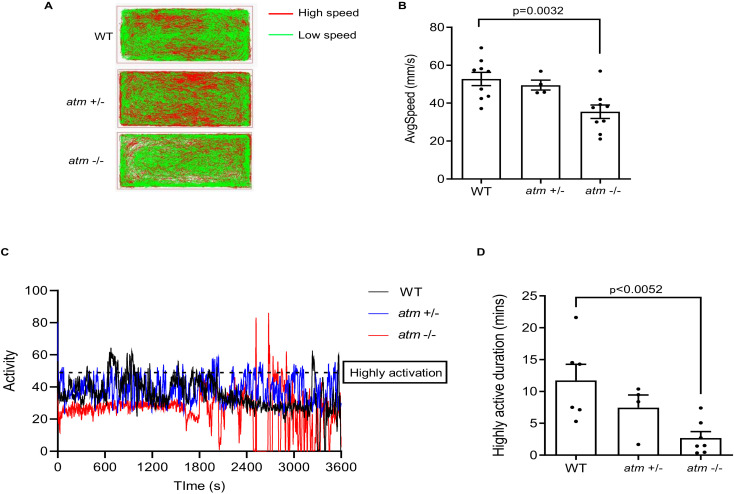
Behavior test of atm−/− zebrafish. (A) Trajectory diagram of 6-month-old WT, atm+/− and atm−/− zebrafish in 60-minue open-field tracking test. (B) Average speed of 6 months old WT, atm+/−, and atm−/− zebrafish in A (n = 9 for WT and atm−/−; n = 4 for atm+/-). (C) Activity diagram of WT, atm+/−, and atm−/− zebrafish in 60-minues open-field quantification test. (D) Highly activation duration of WT, atm+/−, and atm−/− zebrafish (n = 6 for WT; n = 7 for atm−/−; n = 4 for atm+/−). The statistical significance was analyzed using one-way ANOVA. Data are shown as means ± SEM.
                
                    
                        Figure Data


                        Acknowledgments


This image is the copyrighted work of the attributed author or publisher, and
ZFIN has permission only to display this image to its users.
Additional permissions should be obtained from the applicable author or publisher of the image.
      Full text @ Biomedicines


        