
Image
|
Figure Caption
Figure 1
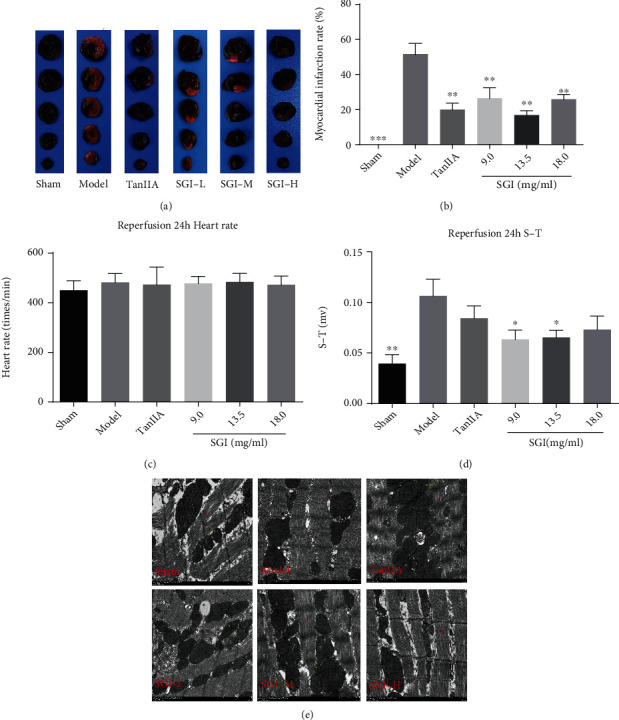
The protective effect of SGI on MIR in rats. (a, b) Dark blue represents normal myocardial tissue, and red represents infarcted myocardium. (c) The effect of SGI on heart rate. (d) The effect of SGI on the S-T segment. (e) Myocardial microstructure by transmission electron microscopy, red arrows represent myocardial fibers and yellow arrows represent mitochondria. Compared with the model group, ∗
Acknowledgments
This image is the copyrighted work of the attributed author or publisher, and
ZFIN has permission only to display this image to its users.
Additional permissions should be obtained from the applicable author or publisher of the image.
Full text @ Comput. Math. Methods Med.