
|
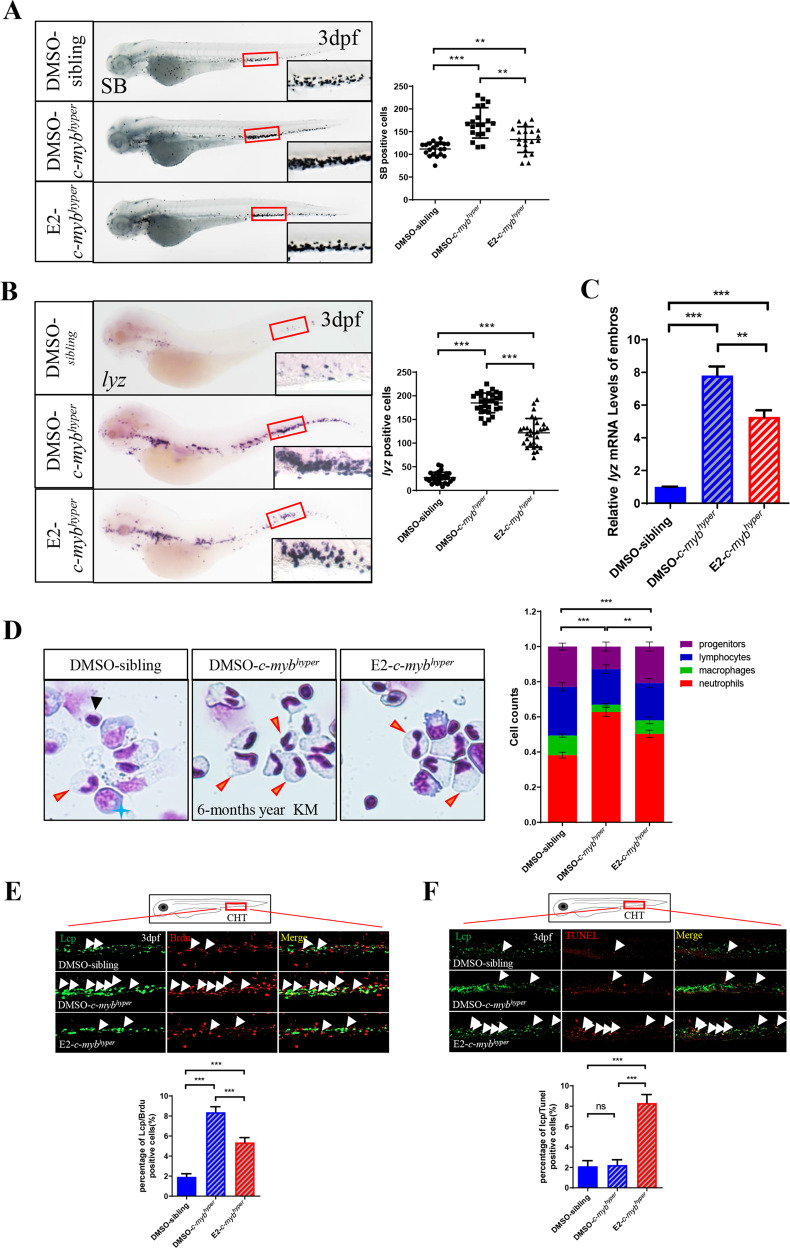
Fig. 2
A E2 exposure decreased SB positive cells in the CHT region. (t-test, ***p < 0.001, **p < 0.01. n > 20). B E2 exposure decreased lyz in the CHT region, as determined by WISH. (t-test, ***p < 0.001, **p < 0.01. n > 20). C The qPCR quantification of the decrease in lyz expression with E2 (t-test, mean ± SEM; ***p < 0.001, **p < 0.01. n ≥ 10). D May-Grunwald-Giemsa staining of whole KM blood cells in 6-month-old c-mybhyper animals followed by four days of E2 treatment (t-test, ***p < 0.001. n = 12). Red arrowheads, blue asterisks, black arrowheads and yellow lightning indicate neutrophils, precursors, lymphocytes and macrophages, respectively. E Double staining of bromodeoxyuridine (BrdU)/Lcp indicated decreased neutrophil proliferation in c-mybhyper zebrafish embryos treated with E2. (one-way ANOVA (LSD) ***p < 0.001, n = 12). F The TUNEL assays showed the effect of E2 on the apoptosis of myeloid lineage in zebrafish embryos (one-way ANOVA (LSD) ***p < 0.001, ns, no significance. n = 12).