
|
Figure 7
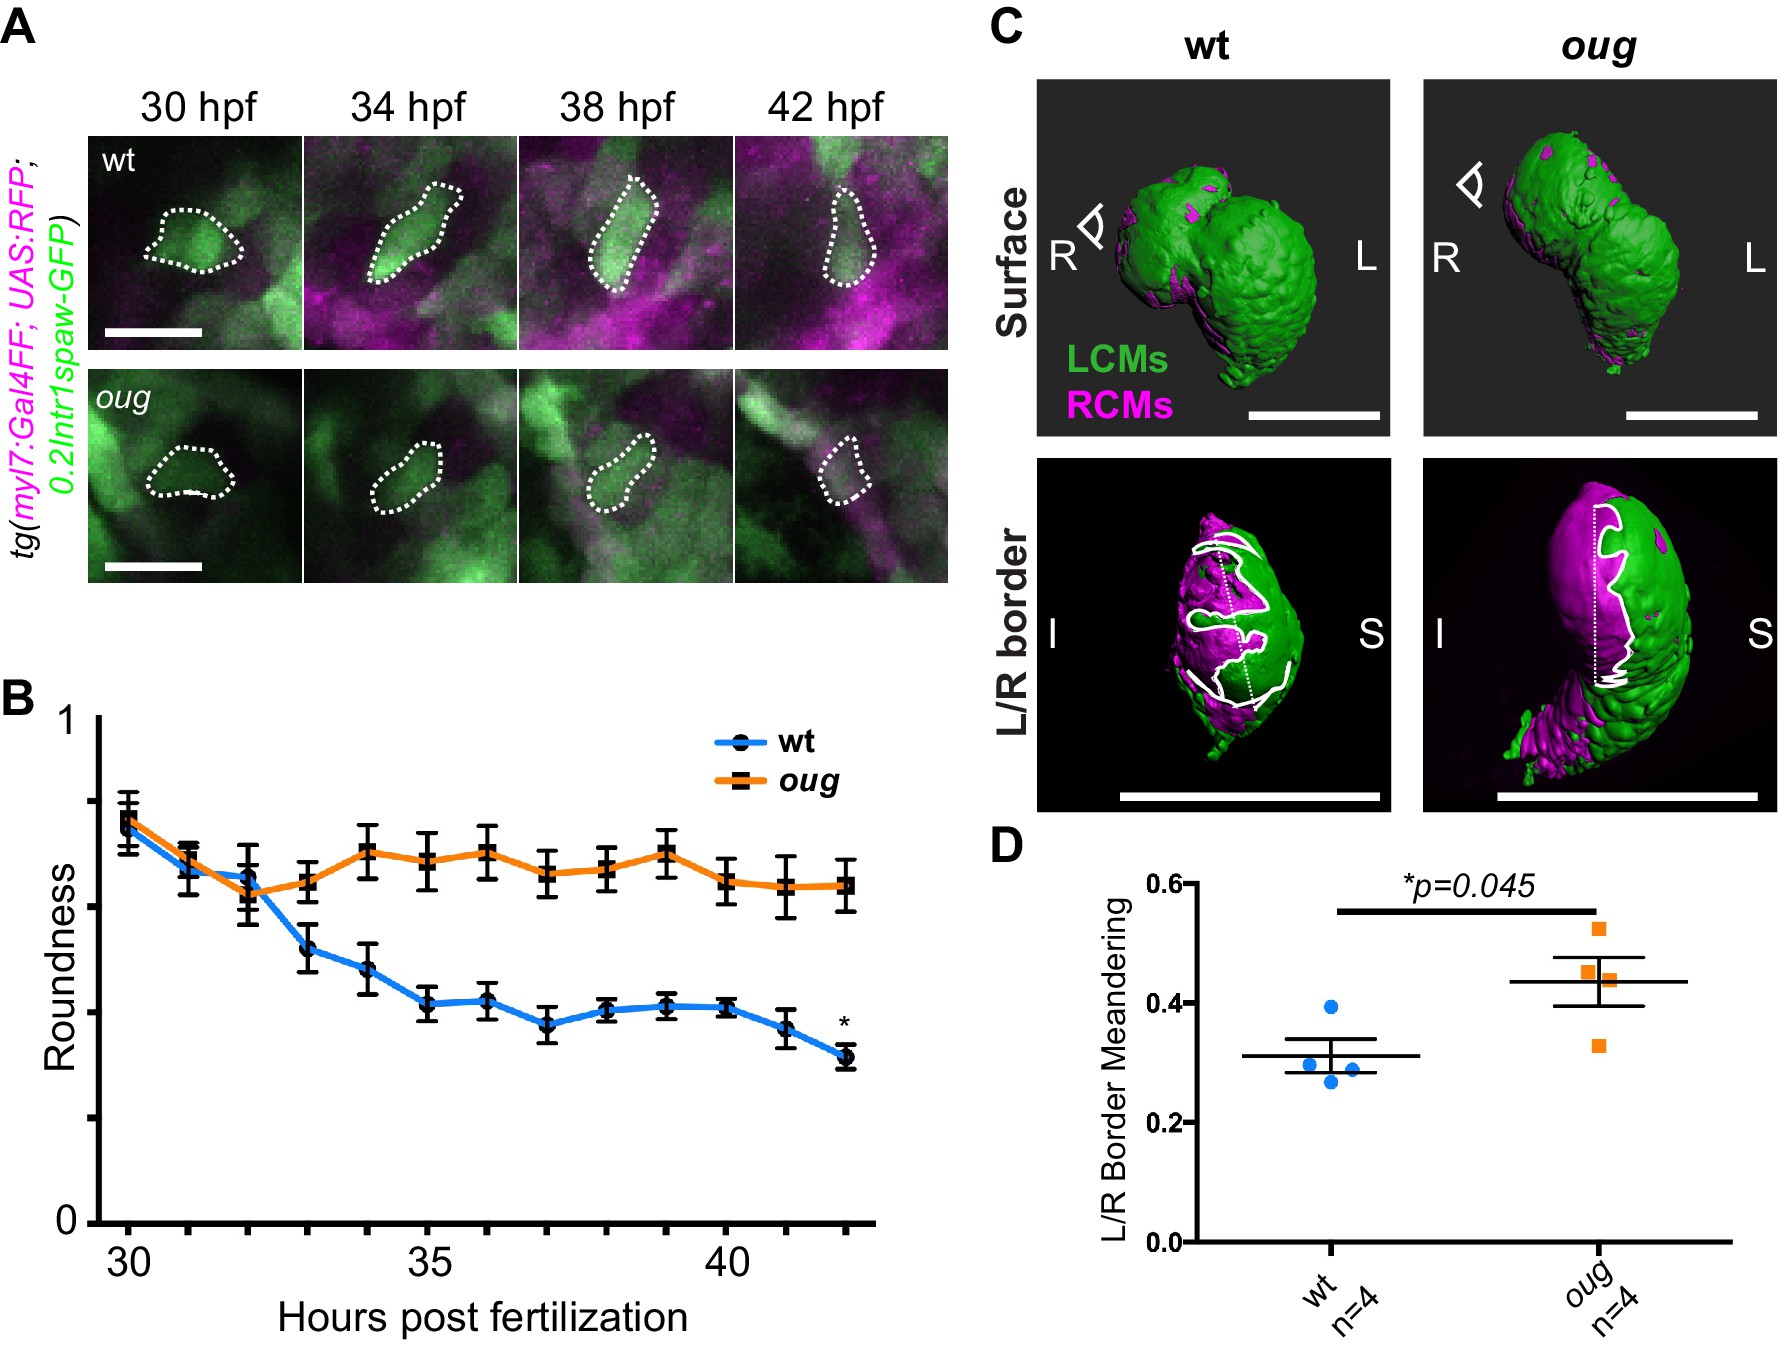
(A) Outline of ventricular cardiomyocytes assessed for assessed for cell roundness. Representative images of the data quantified in (B) are shown for wt (upper row) and oug (lower row). (B) Quantification of cell roundness as observed in (A) and comparison between values for wt and oug mutants. (C) Upper panels: surface rendering of tg(myl7:Gal4FF; UAS:RFP; 0.2Intr1spaw-GFP) in 48 hpf hearts allows clear definition of a boundary between Left-originating cardiomyocytes (LCMs, green) and right-originating cardiomyocytes (RCMs, magenta). This allows calculation of the straightness index of the left/right boundary (white) of the ventricle (lower panels, respective viewpoint indicated in upper panels). The straightness index is calculated as the ratio between distance between start and end point of left/right boundary at (straight dotted line) and length of left/right boundary measured on the ventricular surface. (D) Quantification of the straightness index is indicative of the level of anisotropic growth in wt and oug mutant hearts. (B) and (D): Horizontal bars: mean value ± SEM. Legends: R: Right; L: Left; S; Superior side; I: Inferior side. Scale bars: (A) 20 µm; (C) 100 µm. (A) Outline of ventricular cardiomyocytes assessed for assessed for cell roundness. Representative images of the data quantified in (B) are shown for wt (upper row) and oug (lower row). (B) Quantification of cell roundness as observed in (A) and comparison between values for wt and oug mutants. (C) Upper panels: surface rendering of tg(myl7:Gal4FF; UAS:RFP; 0.2Intr1spaw-GFP) in 48 hpf hearts allows clear definition of a boundary between Left-originating cardiomyocytes (LCMs, green) and right-originating cardiomyocytes (RCMs, magenta). This allows calculation of the straightness index of the left/right boundary (white) of the ventricle (lower panels, respective viewpoint indicated in upper panels). The straightness index is calculated as the ratio between distance between start and end point of left/right boundary at (straight dotted line) and length of left/right boundary measured on the ventricular surface. (D) Quantification of the straightness index is indicative of the level of anisotropic growth in wt and oug mutant hearts. (B) and (D): Horizontal bars: mean value ± SEM. Legends: R: Right; L: Left; S; Superior side; I: Inferior side. Scale bars: (A) 20 µm; (C) 100 µm. (A) Outline of ventricular cardiomyocytes assessed for assessed for cell roundness. Representative images of the data quantified in (B) are shown for wt (upper row) and oug (lower row). (B) Quantification of cell roundness as observed in (A) and comparison between values for wt and oug mutants. (C) Upper panels: surface rendering of tg(myl7:Gal4FF; UAS:RFP; 0.2Intr1spaw-GFP) in 48 hpf hearts allows clear definition of a boundary between Left-originating cardiomyocytes (LCMs, green) and right-originating cardiomyocytes (RCMs, magenta). This allows calculation of the straightness index of the left/right boundary (white) of the ventricle (lower panels, respective viewpoint indicated in upper panels). The straightness index is calculated as the ratio between distance between start and end point of left/right boundary at (straight dotted line) and length of left/right boundary measured on the ventricular surface. (D) Quantification of the straightness index is indicative of the level of anisotropic growth in wt and oug mutant hearts. (B) and (D): Horizontal bars: mean value ± SEM. Legends: R: Right; L: Left; S; Superior side; I: Inferior side. Scale bars: (A) 20 µm; (C) 100 µm.
Anisotropic cell shape changes accompany cardiac looping.
Anisotropic cell shape changes accompany cardiac looping.
Anisotropic cell shape changes accompany cardiac looping.