Image


                        Figure Caption


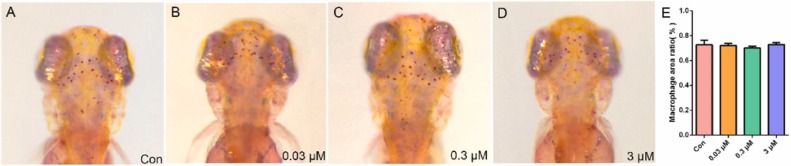
Fig. 6 Fig. 6. Effects of fluxapyroxad on macrophage generation in zebrafish embryos at 3 dpf. (A): DMSO treated embryos. (B): 0.03 μM fluxapyroxad treated embryos. (C): 0.3 μM fluxapyroxad treated embryos. (D): 3 μM fluxapyroxad treated embryos. (E): Quantitative analysis of the macrophage area (Neutral red signal area/head area).
                
                    
                        Figure Data


                        Acknowledgments


This image is the copyrighted work of the attributed author or publisher, and
ZFIN has permission only to display this image to its users.
Additional permissions should be obtained from the applicable author or publisher of the image.
      Full text @ Ecotoxicol. Environ. Saf.


        