IMAGE

Figure 3

ID
ZDB-IMAGE-230615-3
Source
Figures for Schellens et al., 2023
Image
Figure Caption

Figure 3

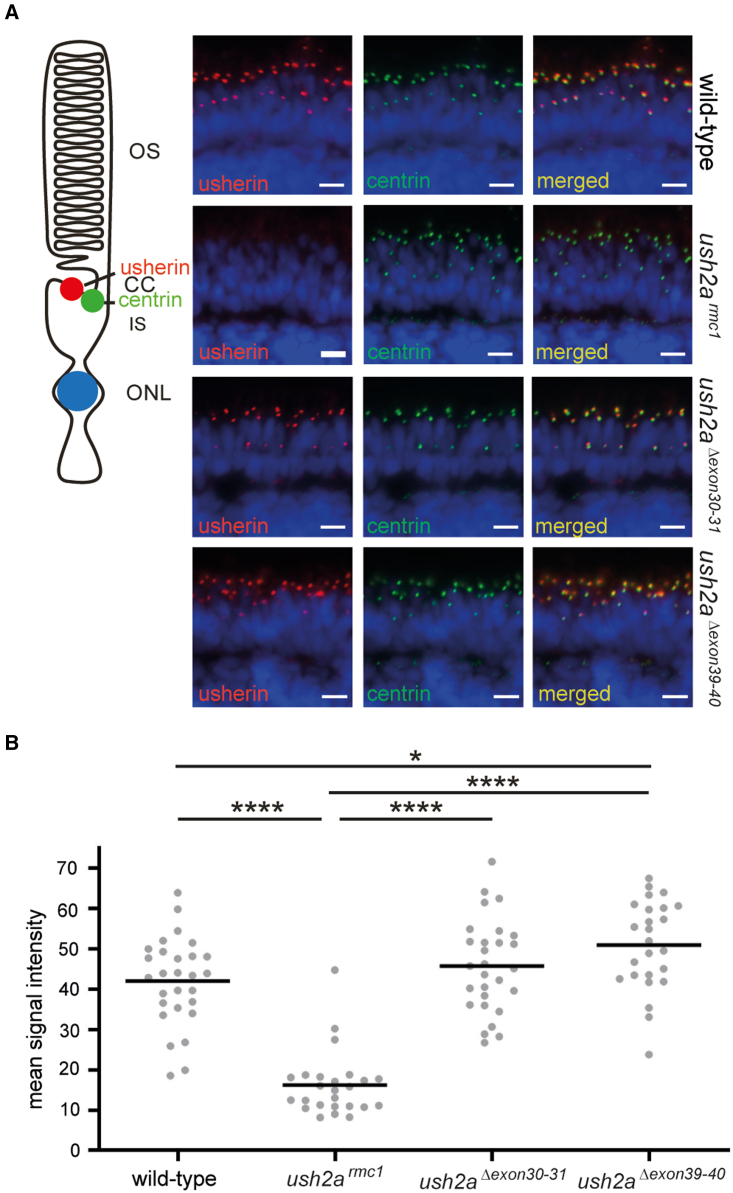
Visualization of usherin on retinal sections of wild-type, ush2armc1, ush2aΔexon30-31, and ush2aΔexon39-40 zebrafish

(A) Retinal cryosections of wild-type, ush2armc1, ush2aΔexon30-31, and ush2aΔexon39-40 larvae (5 dpf) were stained with antibodies directed against usherin (red) and centrin (green). Nuclei are counterstained with DAPI (blue). No usherin signal was detected in the retina of ush2armc1 zebrafish, whereas in the retinas of wild-type, ush2aΔexon30-31, and ush2aΔexon39-40 larvae, usherin was present at the photoreceptor periciliary region, in close proximity to centrin. Scale bar, 10 μm. CC, connecting cilium; IS, inner segment; ONL, outer nuclear layer; OS, outer segment. (B) Quantification of anti-usherin signal intensity at the periciliary region. Individual data points represent the mean fluorescence intensity of anti-usherin staining at the periciliary region of all photoreceptors of a single, central section of one larval zebrafish eye. Horizonal bars depict the mean signal intensity within a genotype (n = 25–28 eyes). Data were analyzed using one-way ANOVA followed by Tukey’s multiple comparison test. ∗p ≤ 0.05. ∗∗∗∗p ≤ 0.0001.

Acknowledgments
This image is the copyrighted work of the attributed author or publisher, and ZFIN has permission only to display this image to its users. Additional permissions should be obtained from the applicable author or publisher of the image. Full text @ Mol Ther Nucleic Acids