
Figure 4
- ID
- ZDB-IMAGE-230615-5
- Publication
- Schellens et al., 2023 - A protein domain-oriented approach to expand the opportunities of therapeutic exon skipping for USH2A-associated retinitis pigmentosa
- All Figures
- Figures for Schellens et al., 2023
|
Figure 4
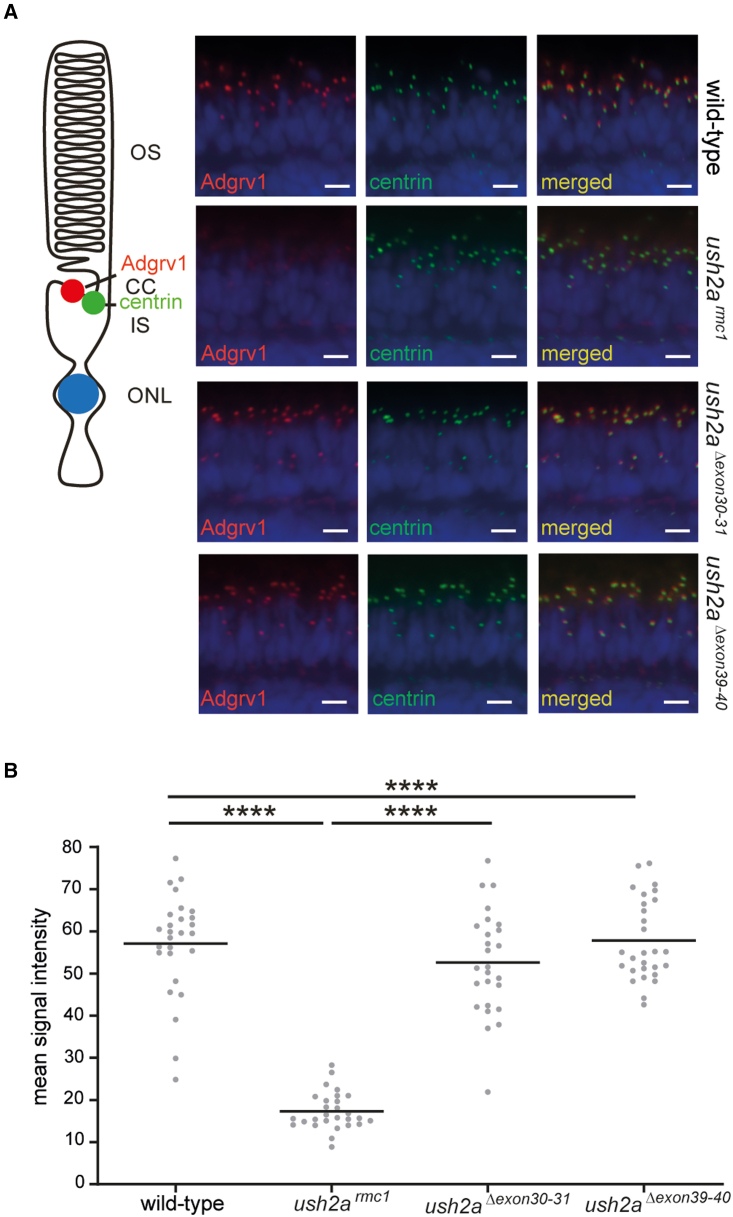
Visualization of Adgrv1 in retinal sections of wild-type, ush2armc1, ush2aΔexon30-31, and ush2aΔexon39-40 zebrafish
(A) Retinal cryosections of wild-type, ush2armc1, ush2aΔexon30-31, and ush2aΔexon39-40 larvae (5 dpf) stained with antibodies directed against Adgrv1 (red) and centrin (green). Nuclei are counterstained with DAPI (blue). A reduced Adgrv1 signal was detected in ush2armc1 zebrafish retinas, whereas in the retinas of wild-type, ush2aΔexon30-31, and ush2aΔexon39-40 larvae, usherin was present adjacent to the centrin immunoreactivity. Scale bar, 10 μm. CC, connecting cilium; IS, inner segment; ONL, outer nuclear layer; OS: outer segment. (B) Quantification of anti-Adgrv1 signal intensity at the periciliary region. Individual data points represent the mean fluorescence intensity of anti-Adgrv1 staining at the periciliary region of all photoreceptors of a single, central section of one larval zebrafish eye. Horizonal bars depict the mean signal intensity within a genotype (n = 26–28 eyes). Data were analyzed using one-way ANOVA followed by Tukey’s multiple comparison test. ∗∗∗∗p ≤ 0.0001.