
|
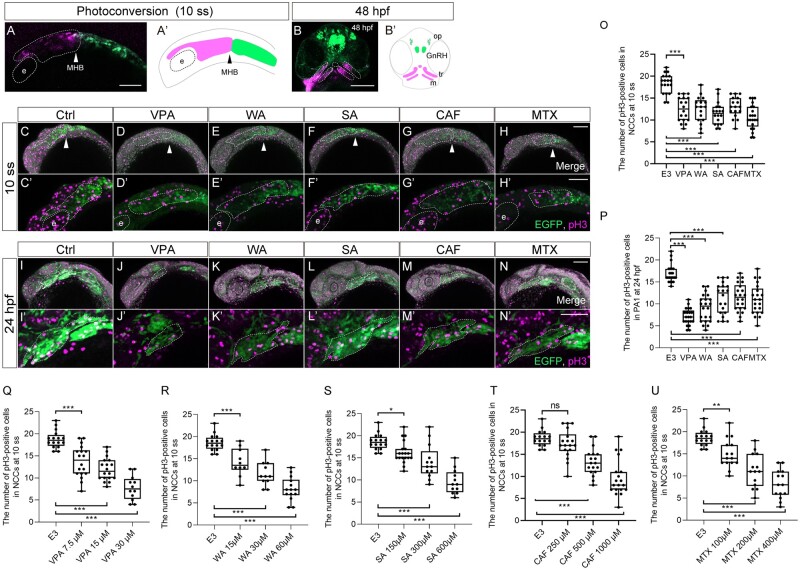
Figure 6.
Cell proliferation was decreased in the migratory and premigratory CNCCs and CNCCs in the PA1 by teratogen treatment. (A, B) The anterior CNCCs (magenta in panel A) were labeled at 10 ss and subsequently differentiated into maxillary (trabeculae), mandibular (Meckel’s cartilage) and frontonasal prominence at 48 hpf (magenta in panel B). (A′, B′) A schematic diagram of the lineage tracing of the anterior CNCCs. Magenta and green indicate the photoconverted region and intact region, respectively. White and black arrowheads in panels A and A′ represent the position of the midbrain-hindbrain boundary (MHB). (C–N′) Immunofluorescence images of mitotic premigratory and migratory CNCCs at 10 ss (C–H′) and 24 hpf (I–N′). VPA-, WA-, SA-, CAF-, and MTX-treated embryos were stained with anti-GFP and anti-phospho-histone H3 (pH3) antibodies. Mitotic premigratory and migratory CNCCs were decreased by teratogen treatment (C–H′). (C′–H′) Magnified view of the panels C–H. Mitotic CNCCs in the PA1 were decreased by teratogen treatment. (I′–N′) Magnified view of the panels I–N. Green represents the CNCCs at 10 ss and the CNCCs in the PA1 at 24 hpf. Magenta indicates the mitotic cells stained with anti-pH3 antibody. White dotted lines trace the eye, the region of the anterior CNCCs at 10 ss and PA1 at 24 hpf. (O, P) Quantification of the number of pH3-positive CNCCs in the area at 10 ss (O) and PA1 at 24 hpf (P).