
|
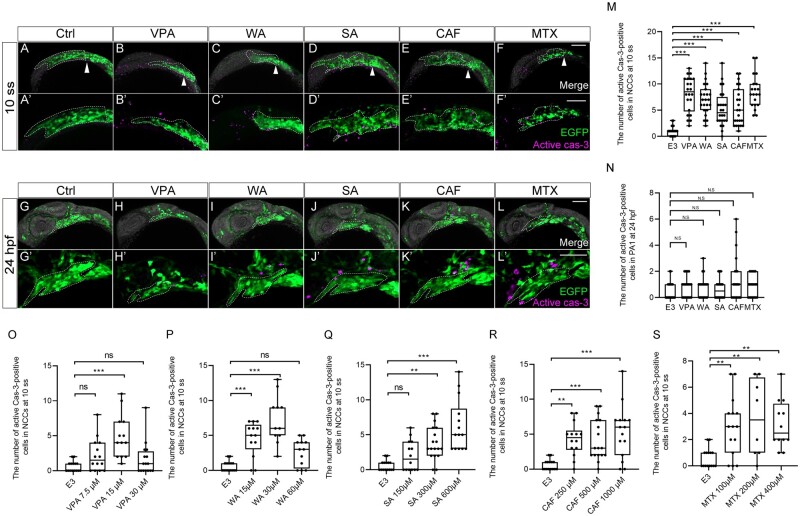
Figure 7.
Apoptosis was increased in premigratory and migratory CNCCs, but not in CNCCs in PA1. (A–L′) Immunofluorescence images of VPA, WA, SA, CAF, and MTX-treated embryos that were stained with anti-active caspase 3 (active cas-3) and anti-GFP antibody at 10 ss (A–F′) and 24 hpf (G–L′). (A–F′) Apoptosis in premigratory and migratory CNCCs was increased by teratogen treatment. White arrowheads indicate the midbrain-hindbrain boundary (MHB). (A′–F′) Magnified view of the panels A–F. (G–L) Apoptotic CNCCs in PA1 were not significantly increased by teratogen treatment. (G′–L′) Magnified view of the panels G–L. Green represents the premigratory and migratory CNCCs at 10 ss and the CNCCs in the PA1 at 24 hpf. Magenta indicates the apoptotic CNCCs stained with anti-active cas-3 antibody. White dotted lines trace the eye and the region of the anterior CNCCs at 10 ss and PA1 at 24 hpf. (M, N) Quantitation of the number of active cas-3-positive CNCCs at 10 ss (M) and PA1 at 24 hpf (N).