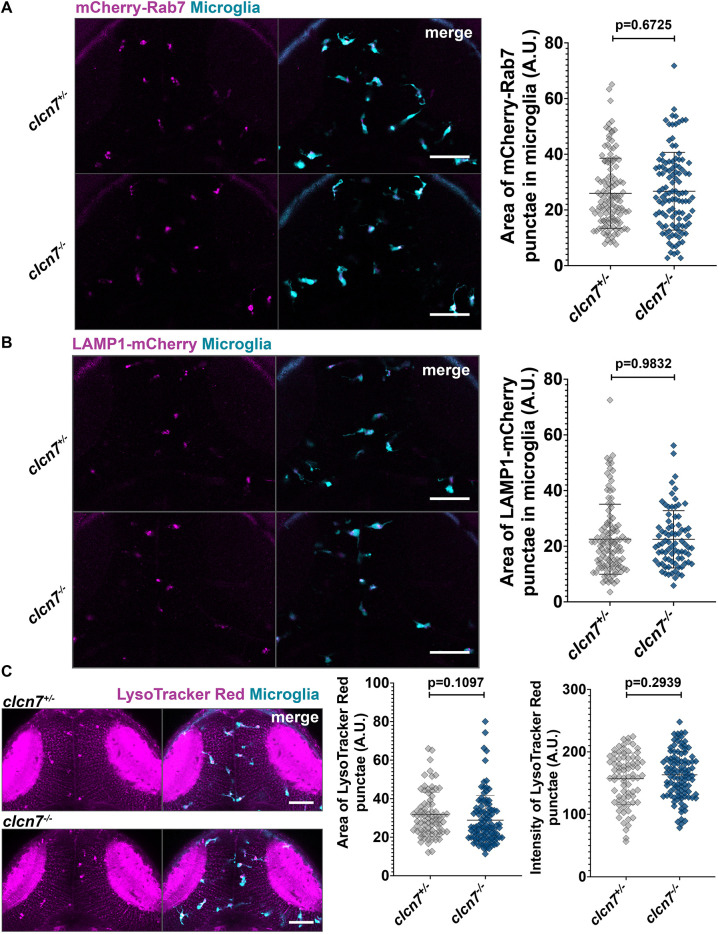
Late endosomal and lysosomal compartments appear normal in clcn7 mutants. Transgenic expression of (A) mCherry-Rab7 and (B) LAMP1b-mCherry driven under the control of mpeg1 regulatory sequences was similar in clcn7 heterozygotes and mutants. mCherry-Rab7; clcn7+/−: n=17, mean=26.0, s.d.=12.6, s.e.m.=1.1. mCherry-Rab7; clcn7−/−: n=8, mean=26.7, s.d.=14.0, s.e.m.=1.3. LAMP1b-mCherry; clcn7+/−: n=18, mean=22.5, s.d.=12.6, s.e.m.=1.2. LAMP1b-mCherry; clcn7−/−: n=8, mean=22.5, s.d.=10.3, s.e.m.=1.2. (C) Area and intensity of LysoTracker Red were similar between clcn7 heterozygotes and mutants. clcn7+/− area: n=14, mean=31.8, s.d.=11.6, s.e.m.=1.3. clcn7−/− area: n=17, mean=28.8, s.d.=12.8, s.e.m.=1.3. clcn7+/− intensity: n=14, mean=157, s.d.=41.1, s.e.m.=4.7. clcn7−/− intensity: n=17, mean=163.3, s.d.=37.5, s.e.m.=3.7. Two-tailed unpaired t-test with Welch's correction was performed to calculate significance; graphs show mean±s.d. Images are representative of two independent experiments. Scale bars: 50 µm. A.U., arbitrary units.
This image is the copyrighted work of the attributed author or publisher, and
ZFIN has permission only to display this image to its users.
Additional permissions should be obtained from the applicable author or publisher of the image.
Full text @ J. Cell Sci.
Your Input Welcome
Thank you for submitting comments. Your input has been emailed to ZFIN curators who may contact you if
additional information is required.
Oops. Something went wrong. Please try again later.