
|
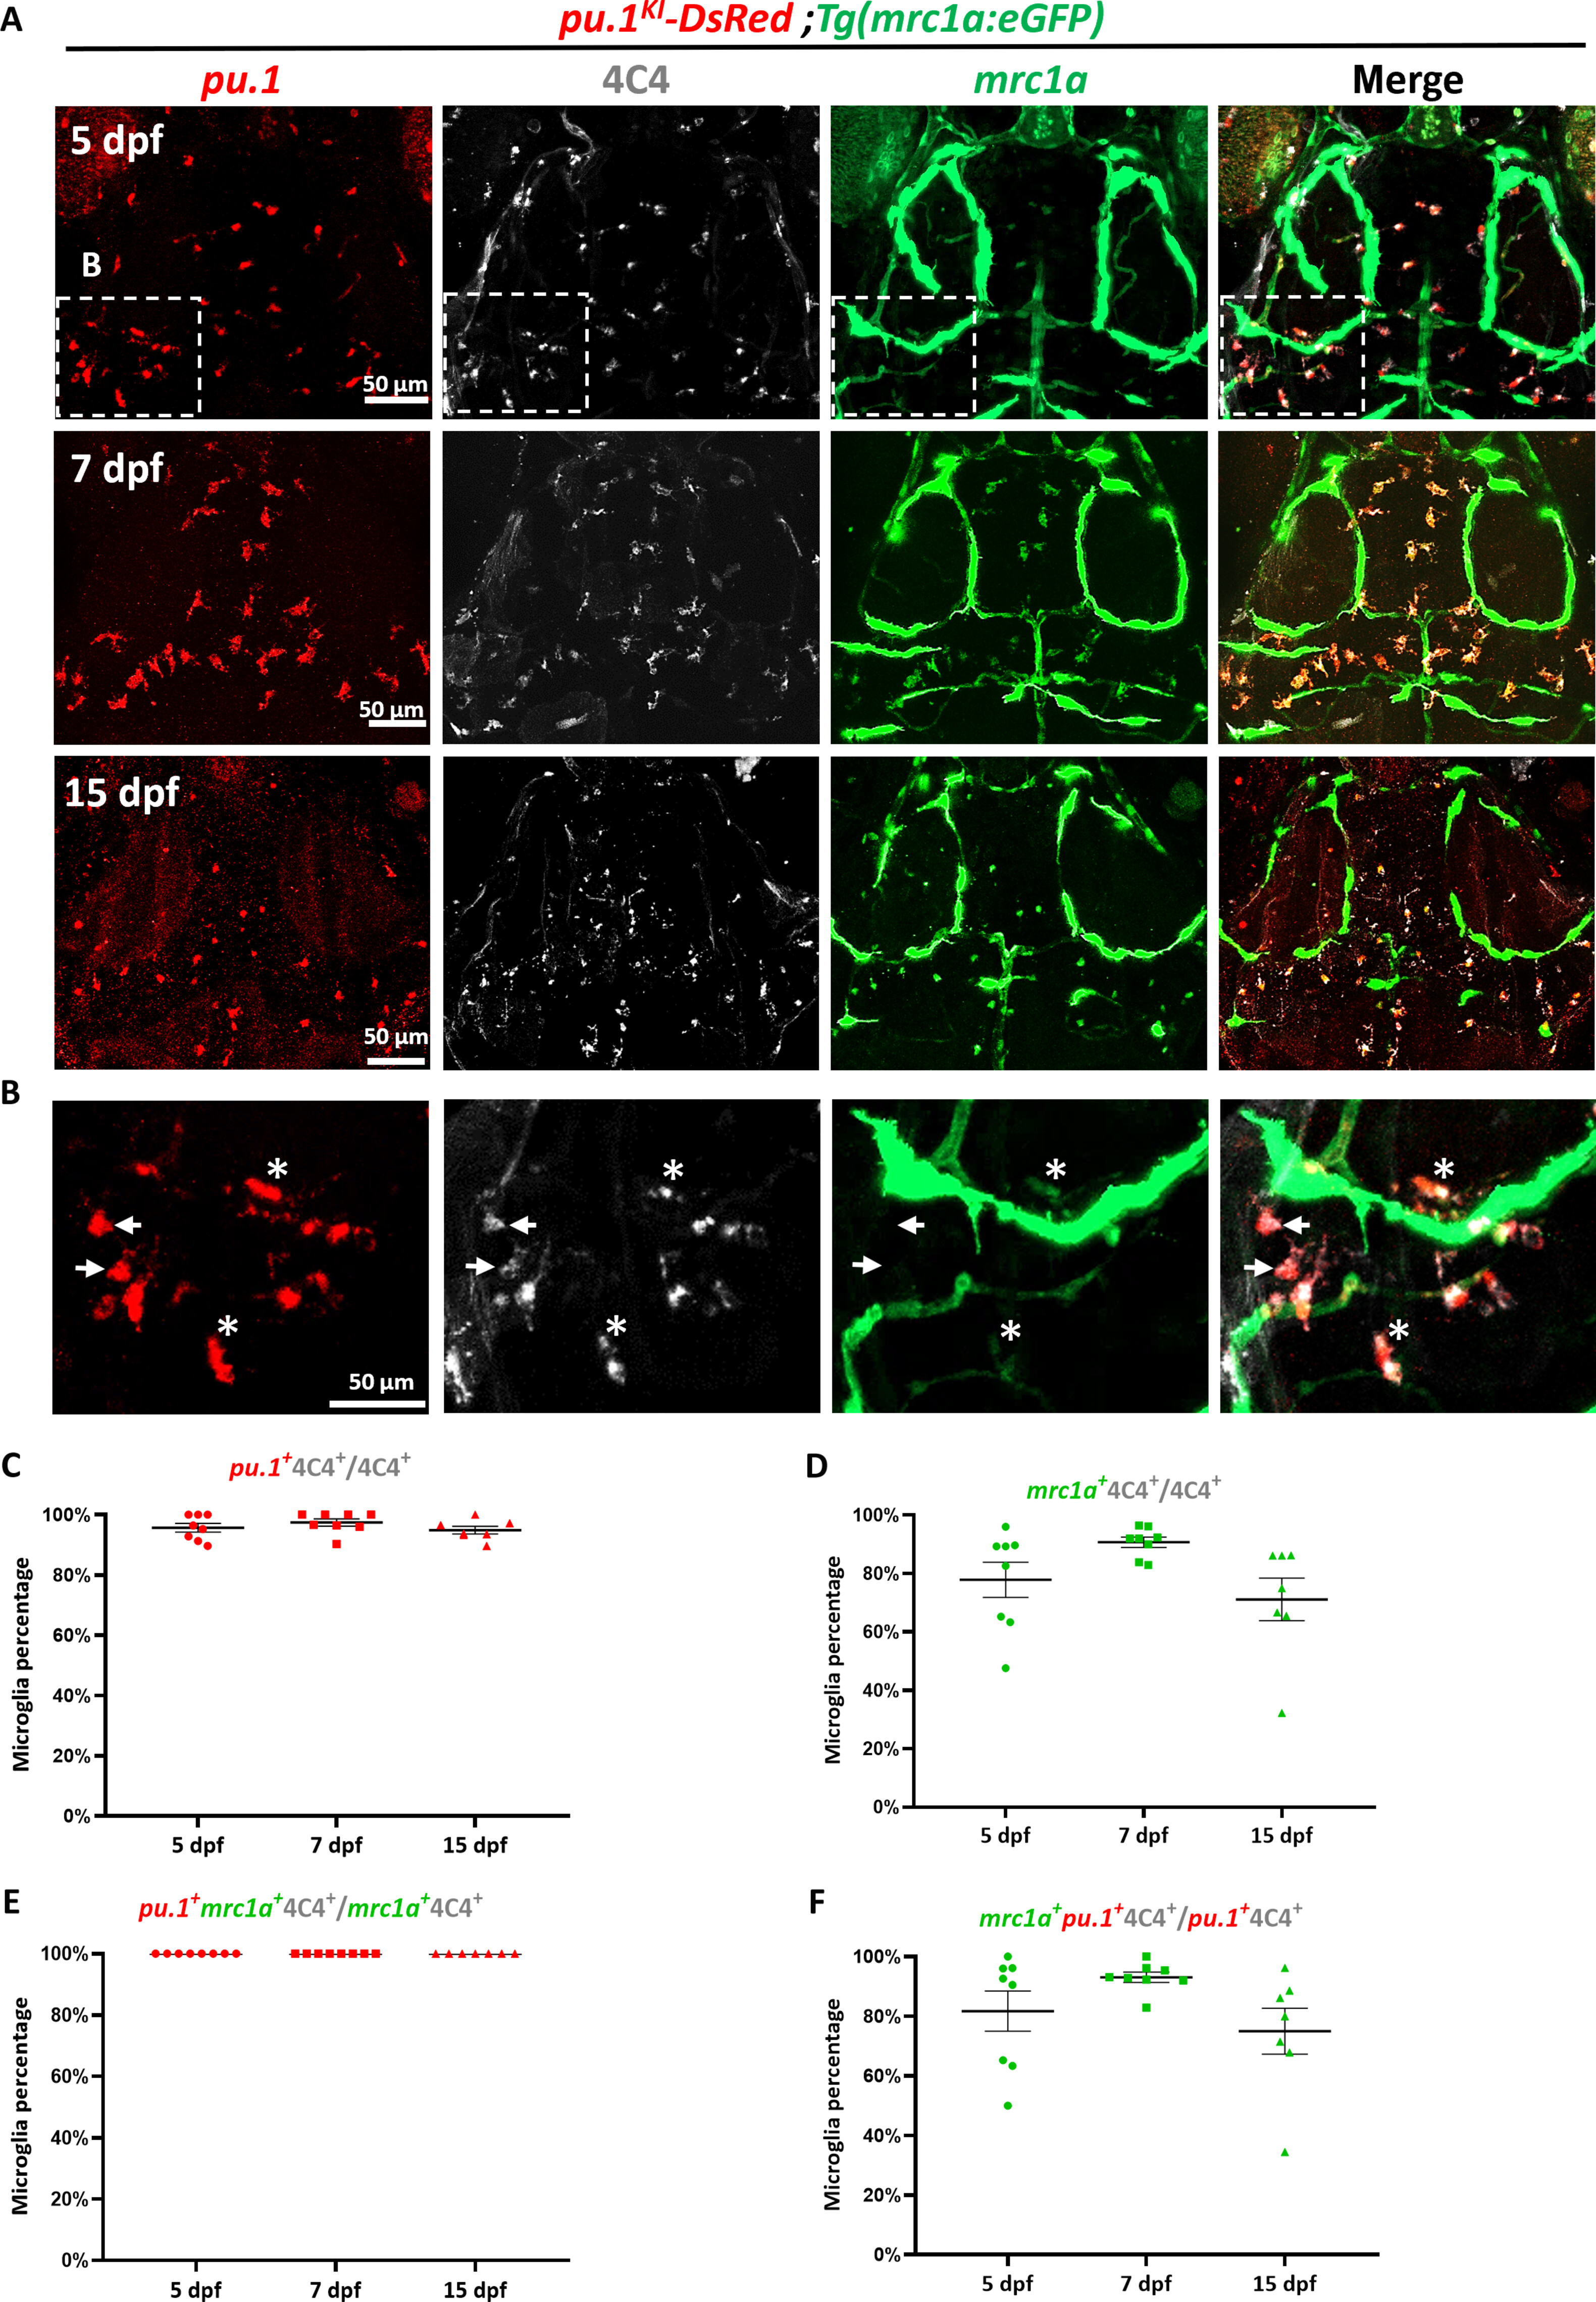
Fig. 1 All mrc1a+ microglia express pu.1 at 5, 7, and 15 dpf. (A) Representative images of pu.1KI-DsRed;Tg(mrc1a:eGFP) embryos stained with DsRed, 4C4, and enhanced green fluorescent protein (eGFP) antibodies at 5, 7, and 15 dpf. (B) Magnified images of the white boxed region in (A). White arrows indicated the pu.1+4C4+mrc1a− microglia. Asterisks indicated the pu.1+4C4+mrc1a+ microglia. (C) Percentage of pu.1+4C4+ microglia in all 4C4+ microglia at 5 dpf (n = 8), 7 dpf (n = 8), and 15 dpf (n = 7). (D) Percentage of mrc1a+4C4+ microglia in all 4C4+ microglia at 5, 7, and 15 dpf. (E) Percentage of pu.1+mrc1a+4C4+ microglia in all mrc1a+4C4+ microglia at 5, 7, and 15 dpf. (F) Percentage of mrc1a+pu.1+4C4+ microglia in all pu.1+4C4+ microglia at 5, 7, and 15 dpf. Error bars represent ± SEM.