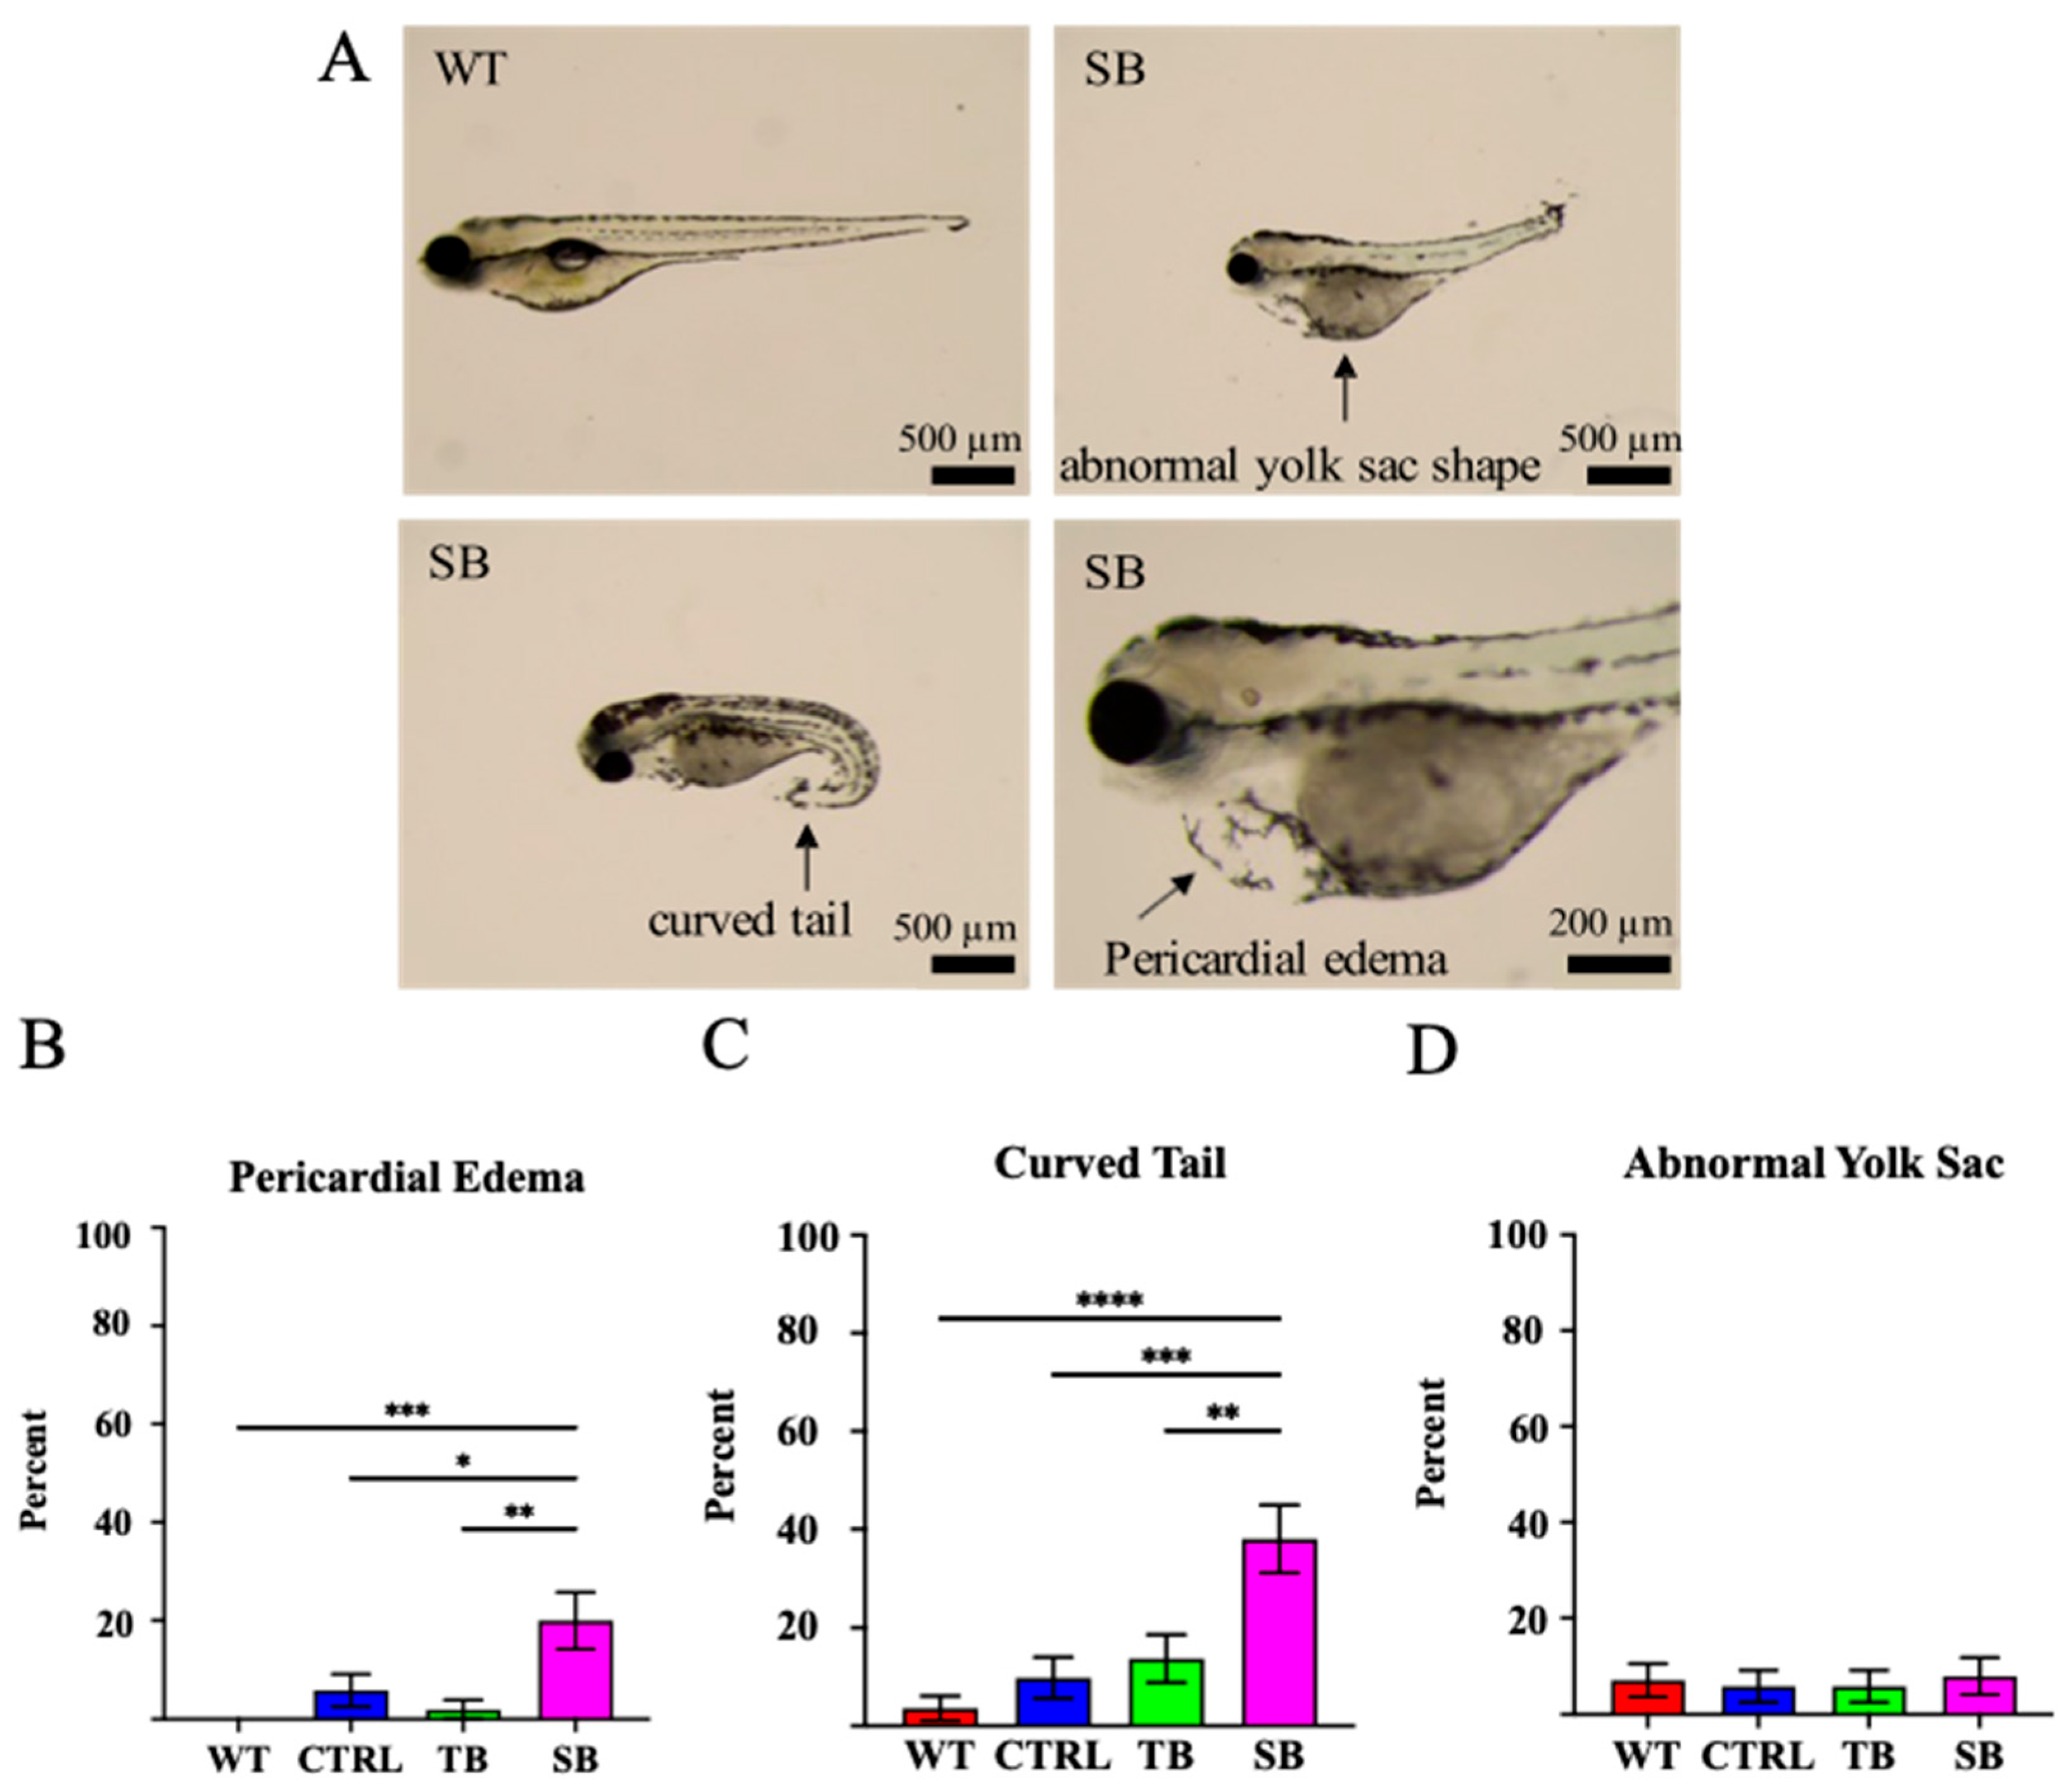
Fig. 3 Phenotypic assessment of CPT2 knockdown larvae. (A). CPT2 knockdown larvae at 5 dpi presented with several predominant phenotypic differences such as pericardial edema, curved tail, and abnormal yolk sac shape. Representative images of SB-injected phenotypes (SB) and wildtype (WT) comparison are shown. Scale bar = 500 µm and 200 µm, respectively. (B–D). Percent of qualitative phenotypic differences was compared between conditions. (A–D). WT = wildtype zebrafish; CTRL = control, scrambled MO-injected zebrafish; TB = translation blocking MO-injected zebrafish; SB = splice blocking MO-injected zebrafish. N = 50 fish per condition. * p ≤ 0.05, ** p ≤ 0.01, *** p ≤ 0.001, **** p ≤ 0.0001. Error bars = SEM.
Image
Figure Caption
Acknowledgments
This image is the copyrighted work of the attributed author or publisher, and
ZFIN has permission only to display this image to its users.
Additional permissions should be obtained from the applicable author or publisher of the image.
Full text @ Biomolecules

