IMAGE

Fig. 5

ID
ZDB-IMAGE-241213-40
Source
Figures for Xu et al., 2024
Image
Figure Caption

Fig. 5 
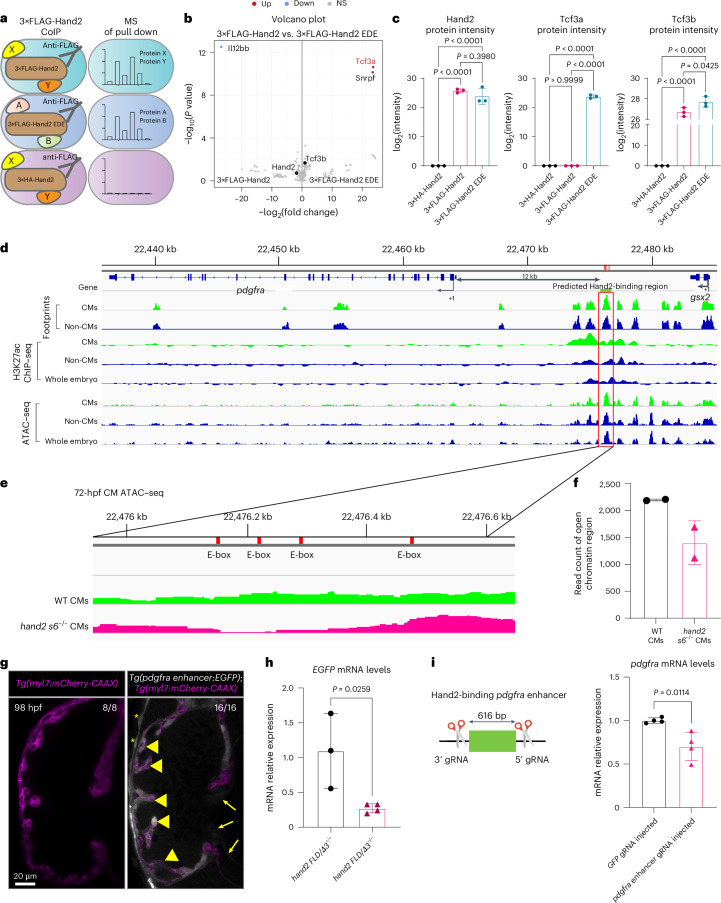
Deletion of a putative Hand2-binding region in a zebrafish pdgfra enhancer results in decreased pdgfra expression in the embryonic heart.

a, Illustration of the CoIP–MS experiment: 14 hpf 3×FLAG-hand2 and 3×FLAG-hand2 EDE mRNA-injected embryos were subjected to FLAG CoIP reactions, controlling for background with 3×HA-hand2 mRNA-injected embryos. The pulled complexes were subjected to MS. b, Volcano plot showing significantly enriched proteins in the FLAG CoIP–MS experiment. Significant proteins are indicated as blue (down) and red (up) dots, and nonsignificant proteins are indicated in gray. c, Protein intensity of Hand2, Tcf3a and Tcf3b in 3×HA-Hand2, 3×FLAG-Hand2 and 3×FLAG-Hand2 EDE protein complexes by MS; error bars are mean ± s.d.; n = 3 biologically independent samples. d, Genome browser view showing ATAC–seq and ChIP–seq peaks enriched in myocardial cells at the pdgfra locus. Red box: predicted Hand2-binding region. e, ATAC–seq genome tracks showing open chromatin regions at the predicted Hand2-binding region in 72 hpf WT (green) and hand2 s6−/− (magenta) cardiomyocytes. The tracks show the peak signal intensity for open chromatin regions (data analyzed from GSE120238 (ref. 55)). Red boxes: conserved E-boxes in the –12-kb pdgfra enhancer. f, Normalized read count for the open chromatin region across the predicted Hand2-binding region (from chr20: 22,476,180–22,476,620 bp) in 72 hpf WT and hand2 s6−/− cardiomyocytes (data analyzed from GSE120238 (ref. 55)); error bars are mean ± s.d.; n = 2 biologically independent samples. g, Confocal images of hearts from representative 98 hpf Tg(myl7:mCherry-CAAX) larvae not carrying (left) or carrying (right) the pdgfra enhancer:EGFP transgene; EGFP fluorescence is detectable in the heart of the representative double-transgenic larva (in cardiomyocytes (short arrows) and endocardial cells (long arrows) and in some pericardial cells (asterisks)); EGFP is shown in white, and cardiomyocyte membranes are shown in magenta (myl7:mCherry-CAAX). h, Relative mRNA levels of EGFP in 18 hpf Tg(pdgfra enhancer:EGFP); hand2 FLD/Δ3+/+ and Tg(pdgfra enhancer:EGFP); hand2 FLD/Δ3−/− sibling embryos; error bars are mean ± s.d.; n = 3 hand2 FLD/Δ3+/+ and n = 4 hand2 FLD/Δ3−/−. i, Left, schematic of the strategy to generate Hand2-binding pdgfra enhancer crispant embryos. Right, relative mRNA levels of pdgfra in the hearts of GFP crispant and Hand2-binding pdgfra enhancer crispant embryos at 24 hpf. P values were calculated using a one-way ANOVA multiple-comparison test (c) or an unpaired Student’s t test (h, i (right)); error bars are mean ± s.d.; n = 4 biologically independent samples. The proportion of larvae matching the image shown is indicated in the top right corner of each image. The scale bar applies to all images. Ct values of qPCR data are listed in Supplementary Table 1.

Acknowledgments
This image is the copyrighted work of the attributed author or publisher, and ZFIN has permission only to display this image to its users. Additional permissions should be obtained from the applicable author or publisher of the image. Full text @ Nat Cardiovasc Res