
|
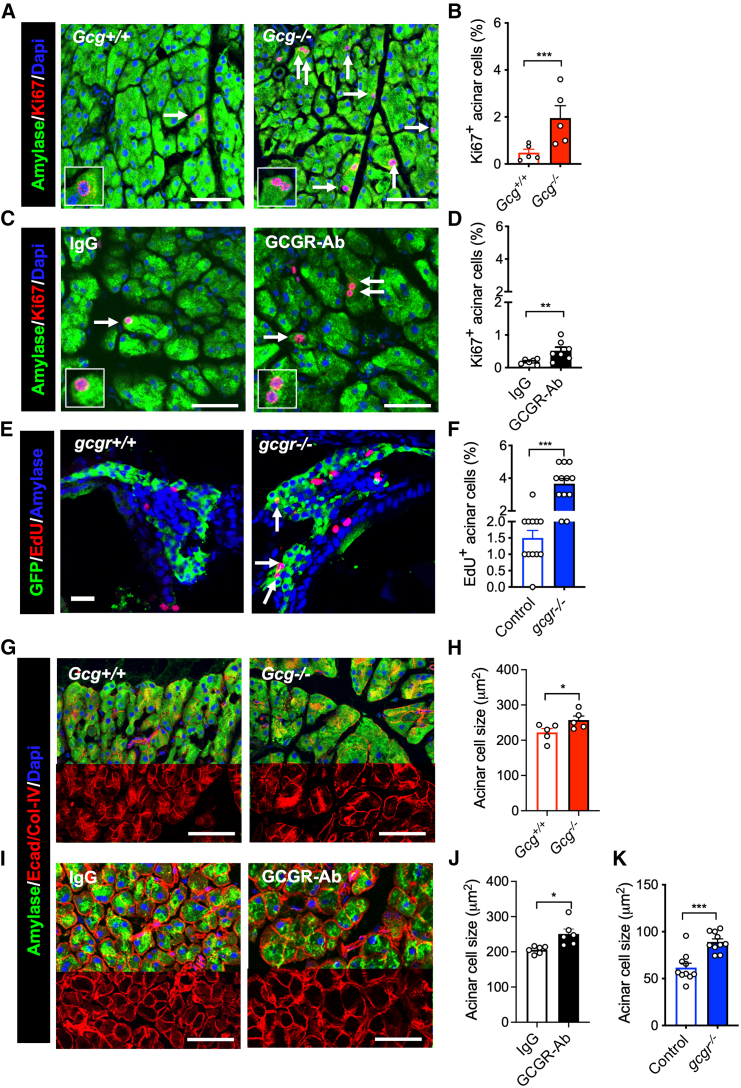
Figure 1
IGS increases acinar cell proliferation and cell size
(A and C) Representative images of acinar tissue immunofluorescence of amylase (green) and Ki67 (red). DAPI (blue) was used to label the nuclei. The pancreas sections were from
(B and D) Quantification of Ki67 positive acinar cell (n = 5–7). Arrows point to Ki67+ cells.
(E) Representative immunofluorescent images of pancreas sections from 18 dpf zebrafish. Green (GFP), red (EdU), and blue (Amylase). Arrows, EdU+ acinar cells.
(F) Quantification of EdU-positive acinar cells (
(G and I) Representative images of acinar tissue immunofluorescence of Amylase (Green), E-cadherin, and Collagen (Red). DAPI (blue) was used to label the nuclei. The pancreas sections were from
(H and J) Measurements of acinar cell size (by area) in the two mouse models.
(K) Average acinar cell size of control and