IMAGE

Fig. 3

ID
ZDB-IMAGE-250118-53
Source
Figures for Cero et al., 2024
Image
Figure Caption

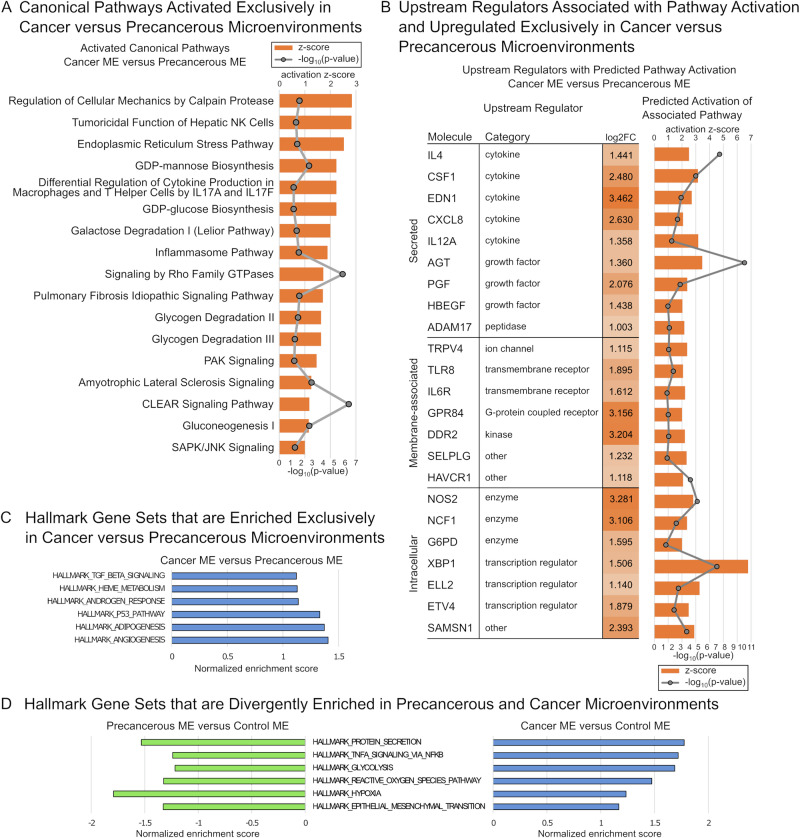
Fig. 3 Pathway and gene set enrichment analyses identify gene expression changes that uniquely characterize the cancer versus precancerous microenvironment.

A Canonical pathways identified by Ingenuity Pathways Analysis (IPA) that were predicted to be activated exclusively in the comparison of cancer versus precancerous microenvironments (MEs). B Genetic upstream regulators associated with predicted pathway activation as identified by IPA that were significantly upregulated exclusively in the comparison of cancer versus precancerous MEs. C Gene set enrichment analysis (GSEA) identifies six hallmark gene sets with a positive normalized enrichment score (NES) exclusively in the comparison of cancer versus precancerous MEs. D GSEA identifies 6 hallmark gene sets with a negative NES in the comparison of precancerous versus control MEs, but a positive NES in the comparison of cancer versus control MEs.

Acknowledgments
This image is the copyrighted work of the attributed author or publisher, and ZFIN has permission only to display this image to its users. Additional permissions should be obtained from the applicable author or publisher of the image. Full text @ Oncogene