
|
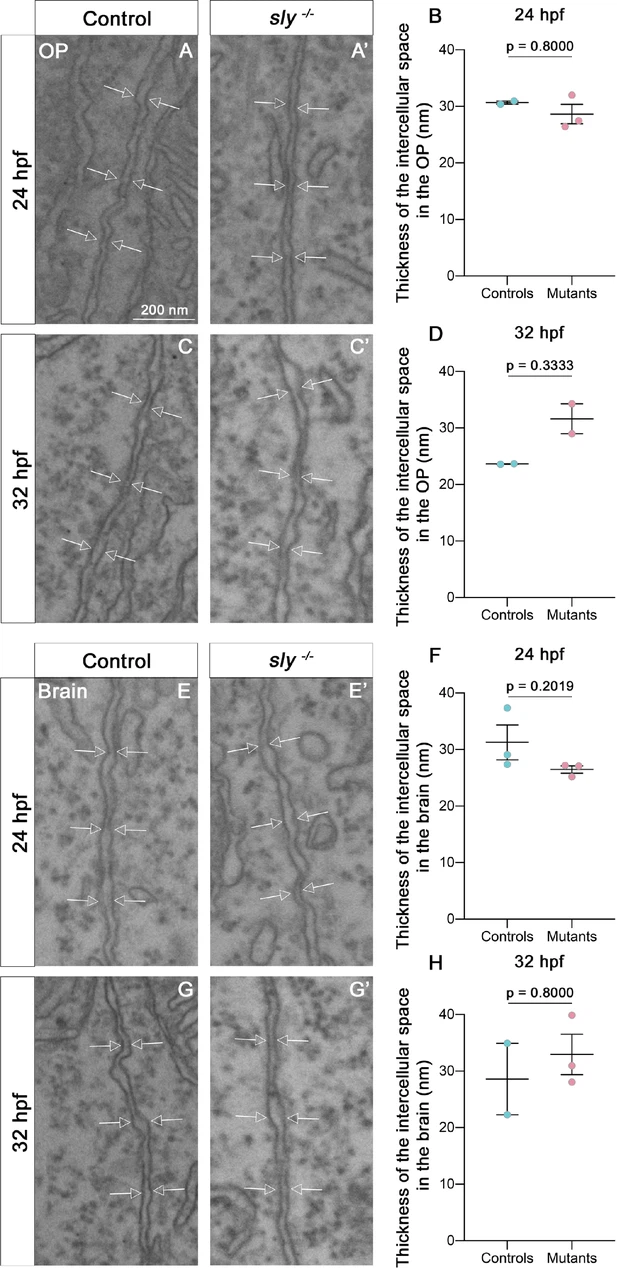
Fig. 2 - Supplemental 1 Electron microscopy analysis of intercellular spaces in the OP and brain tissues. A, A’ and C, C’ Examples of images of the intercellular space located between OP cells in control siblings (A, C) and in sly mutants (A’, C’), at 24 and 32 hpf. Arrows = plasma membranes. (B, D) Thickness of the intercellular space in the OP tissue in sly mutants and control siblings at 24 (n=2 controls; n=3 mutants) and 32 hpf (n=2 controls; n=2 mutants). (E, E’ and G, G’) Examples of images of the intercellular space located between brain cells in control siblings (A, C) and in sly mutants (A’, C’), at 24 and 32 hpf. Arrows = plasma membranes. (F, H) Thickness of the intercellular space in the brain tissue in sly mutants and control siblings at 24 (n=3 controls; n=3 mutants) and 32 hpf (n=2 controls; n=3 mutants). Mann Whitney tests except for F: unpaired, two-tailed t-test.