
|
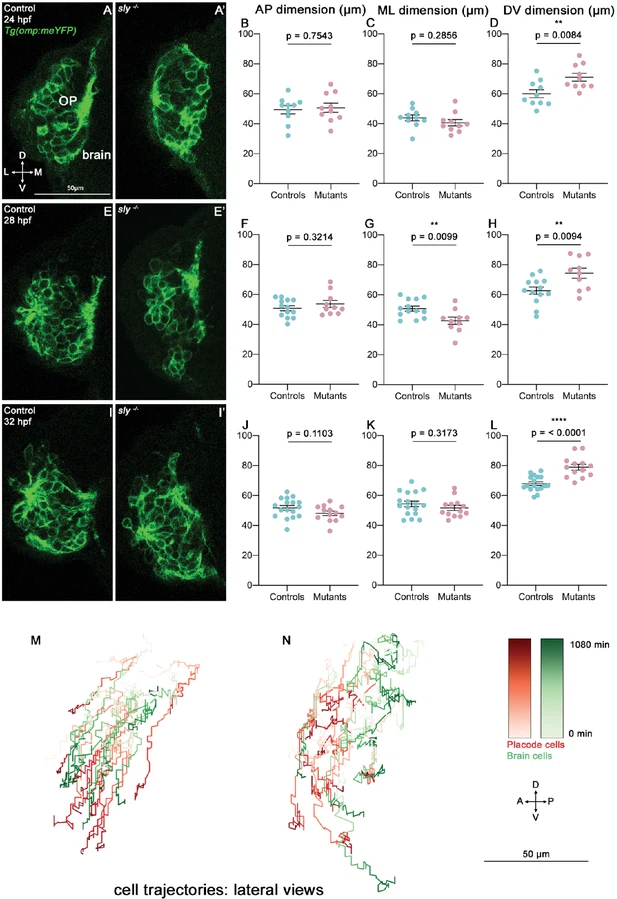
Fig. 4 - Supplemental 1 Additional results on the OP morphogenesis defects observed in sly mutants. (A-L) Analysis of OP dimensions at 24, 28, and 32 hpf. (A, A’, E, E’ and I, I’) Images (frontal views, 1 z-section) of representative OPs from Tg(omp:meYFP); sly -/- mutants (right) and control Tg(omp:meYFP) siblings (left) at 24 (A, A’), 28 (E, E’) and 32 hpf (I, I’). B–D Graphs showing the AP, ML, and DV dimensions of the Tg(omp:meYFP)+ OP clusters in sly mutants and control siblings at 24 hpf (n=10 controls and n=10 mutants from three independent experiments). Ectopic fluorescent cells (cells that are physically separated from the main cluster) were not taken into account for the measurement of OP dimensions. Unpaired, two-tailed t test. (F–H). Similar quantifications at 28 hpf (n=13 controls and n=10 mutants from two independent experiments). Unpaired, two-tailed t tests. (J–L). Similar quantifications at 32 hpf (n=17 controls and n=13 mutants from two independent experiments). Unpaired, two-tailed t tests. Quantifications performed at 36 hpf are shown in Figure 4C–E. (M, N) Examples of 2D tracks plotted in a lateral view (AP along X and DV along Y) of Tg(omp:meYFP)+ OP cells (red) and adjacent brain cells (green) in a control (M) and a sly mutant embryo (N). The time is colour-coded: light colours at the beginning of the trajectory (22 hpf) towards dark colours for the end of the track (1080 min later).