IMAGE

Fig. 6.

ID
ZDB-IMAGE-250219-51
Source
Figures for Gjorcheska et al., 2025
Image
Figure Caption

Fig. 6.

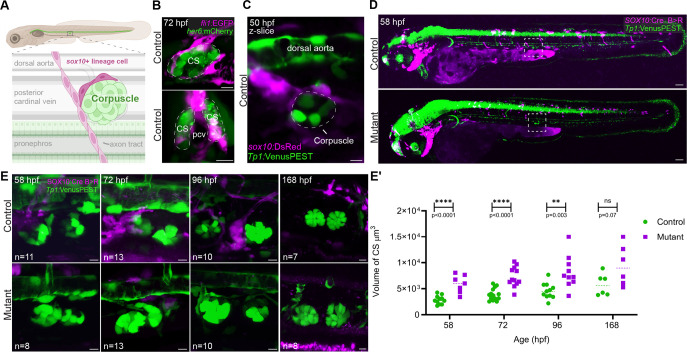
sox10+ crest-derived cells surround the CS and are missing in sox10 mutants. (A) Schematic of the corpuscles' position and surrounding environs. The glands are positioned ventral to the dorsal aorta, dorsal to the pronephros, and flanking the posterior cardinal vein (pcv). sox10+ lineage cells branch off neighboring axon tracts (lined with sox10+ Schwann cells and Schwann cell precursors) to contact the corpuscles. (B) Control 72 hpf larva doubly transgenic for fli1:EGFP (magenta; labeling vasculature) and her6:mCherry (green; labeling the corpuscles). Top image is a single optical section from the lateral perspective showing endothelial cells wrapping around the CS. Bottom image is a maximum intensity projection rotated orthogonally to show the close interaction of the CS with the pcv. (C) Single optical section showing sox10:DsRed+ cells in close contact with the Tp1:VenusPEST+ corpuscles (outlined) by 50 hpf. (D,E) Whole-mount live imaging of SOX10:Cre B>R; Tp1:VenusPEST fish showing sox10+ lineage cells surrounding the CS at earlier stages (58 and 72 hpf), nearby at 96 and 168 hpf, and absent in the sox10 mutants. The entire fish is shown in D to highlight the deficiency of trunk NCCs (magenta) with the box indicating the region shown in E. (E′) Volume measurements of control and mutant Tp1:VenusPEST+ CS between 58 and 168 hpf. Only the right CS, closest to the microscope lens, was measured. (unpaired t-tests; 58 hpf: P=0.0001, d.f.=16; 72 hpf: P=0.00001, d.f.=24; 96 hpf: P=0.003, d.f.=19; 168 hpf: P=0.068, d.f.=10). In E′, dashed lines indicate the median. ns, not significant. Scale bars: 10 µm (B,D,E); 100 µm (C).

Figure Data
Acknowledgments
This image is the copyrighted work of the attributed author or publisher, and ZFIN has permission only to display this image to its users. Additional permissions should be obtained from the applicable author or publisher of the image. Full text @ Development