
Image
|
Figure Caption
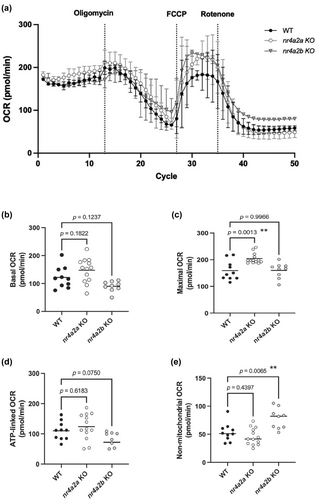
Fig. 5 Metabolism in WT, nr4a2a and nr4a2b mutant larval zebrafish. (a) The mitochondrial oxygen consumption rate (OCR) (pmol/min) over time in zebrafish with three different genotypes (5 min per cycle). (b–e) Average basal OCR, maximal OCR, ATP-linked OCR, and non-mitochondrial OCR for nr4a2 mutant zebrafish relative to the WT controls. (n = 9–13). One = way ANOVA. DF: Within group = 29, between groups =2. b: F = 6.533, p = 0.0045; c: F = 9.688, p = 0.0006; d: F = 4.825, p = 0.0135; e: F = 10.27, p = 0.0004. Bars represent the Mean ± the SEM.
Acknowledgments
This image is the copyrighted work of the attributed author or publisher, and
ZFIN has permission only to display this image to its users.
Additional permissions should be obtained from the applicable author or publisher of the image.
Full text @ J. Neurochem.