
|
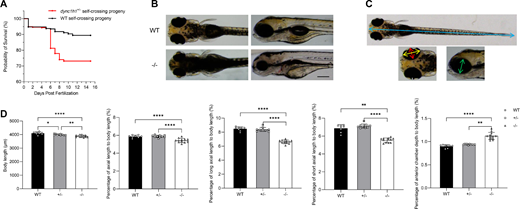
Fig. 2 Impact of dync1h1 loss on zebrafish survival and overall development. (A) Kaplan-Meier survival curve for the progeny of self-crossed WT or dync1h1+/− zebrafish. (B) External morphology of WT and dync1h1+/− zebrafish at 5 dpf. (C) Schematic diagram illustrating measurement indicators at 5 dpf: body length (blue), axial length (red), long axial length (yellow), short axial length (green), and anterior chamber depth (white). (D) Quantitative analysis of binocular measurements as a percentage of body length in WT, dync1h1+/−, and dync1h1−/− zebrafish at 5 dpf. +/−, dync1h1 heterozygote; −/−, dync1h1 homozygote. Scale bar = 200 µm. Data were presented as mean ± SD. *, P < 0.05; **, P < 0.01; ****, P < 0.0001, n = 8 (WT), n = 10 (dync1h1+/−), and n = 12 (dync1h1−/−). dpf, days post fertilization; SD, standard deviation; WT, wild type.