
Fig. 5
- ID
- ZDB-IMAGE-250403-68
- Publication
- Anderson et al., 2025 - Hypusinated and unhypusinated isoforms of the translation factor eIF5A exert distinct effects in models of pancreas development and function
- All Figures
- Figures for Anderson et al., 2025
|
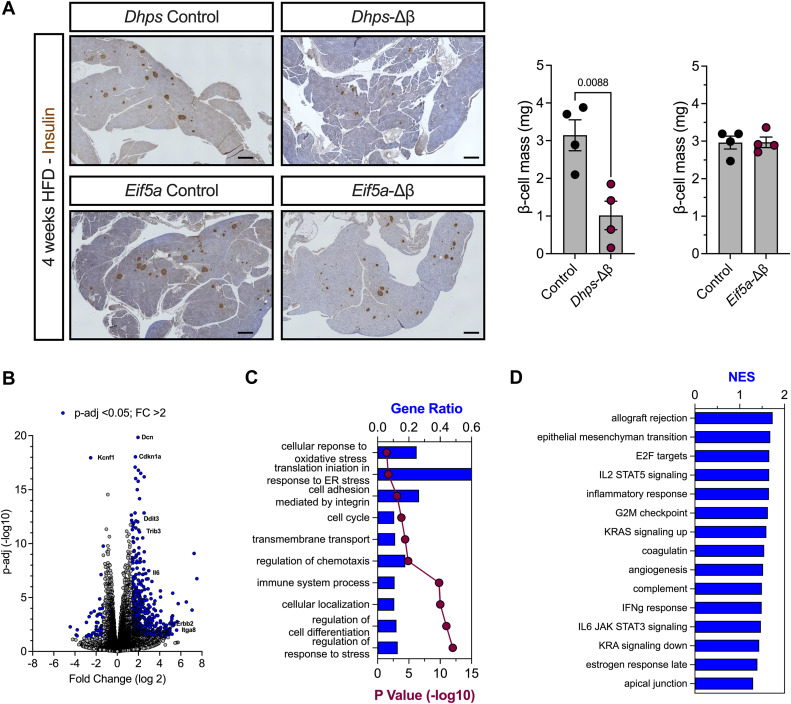
Fig. 5 β-cell–specific Dhps and Eif5a1 deletions in adult mice on β-cell mass expansion in response to 4 weeks of HFD. N = 4 mice per group. A, representative images (left panels) immunostained for insulin and quantitation of β-cell mass (right bar graphs) in littermate control, Dhps-Δβ, and Eif5a-Δβ mouse pancreata after 4 weeks of HFD. Scale bar represents 100 μm. Each point represents one mouse. B, volcano plot showing genes with altered expression in Dhps-Δβ mouse islets compared with Dhps control mouse islets; blue circles indicate genes that satisfy the cutoff threshold of p-adj <0.05 and fold change >2. C, Gene Ontology (GO) pathways of Dhps-Δβ mouse islets compared with littermate control mouse islets. D, gene set enrichment analysis of Dhps-Δβ mouse islets compared with littermate control mouse islets. Data are presented as mean ± SEM, and statistical significance was determined by an unpaired t test. HFD, high-fat diet.