IMAGE

Figure 6

ID
ZDB-IMAGE-250417-123
Source
Figures for Derrick et al., 2024
Image
Figure Caption

Figure 6

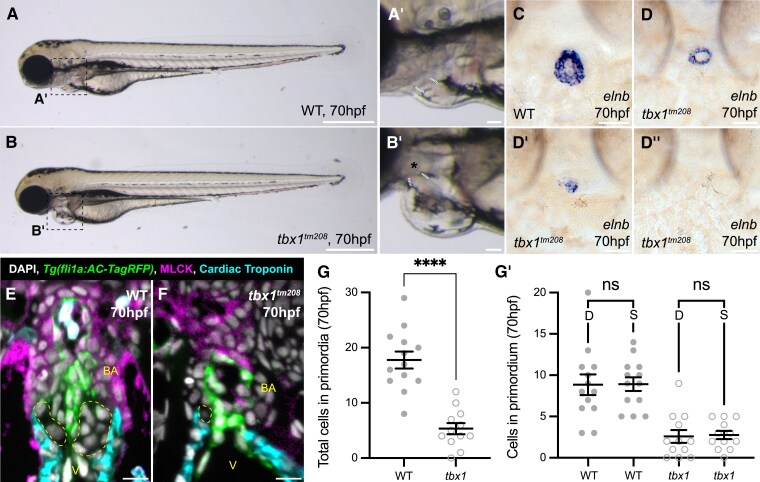
tbx1 mutants have a dysmorphic OFT and hypocellular arterial valve primordia. (AB′) Representative brightfield image of WT sibling (A, n = 6) and tbx1tm208 homozygous mutant (B, n = 12) at 70 hpf, dashed boxes in (A) and (B) highlights heart shown in (A′) and (B′). In tbx1tm208 mutants (B′), the pharyngeal arches are absent (asterisk), and the angle of the OFT angle is steeper than in WT (white). (CD″) Representative images of mRNA in situ hybridization for elnb in WT sibling (C) and tbx1tm208 homozygous mutants (DD″) at 70 hpf. tbx1 mutants display variability in size of elnb domain. (E and F) Representative midline sections of immunohistochemistry on WT sibling (E) and tbx1tm208 homozygous mutants (F) carrying Tg(fli1a:AC-TagRFP) to mark the endocardium (green), cardiac troponin (cyan), and MLCK (magenta). The tbx1tm208 OFT is smaller and dysmorphic with diffuse MLCK expression. (G and G′) Quantification of number of cells in arterial valve primordia (yellow, E and F) at 70 hpf in WT sibling and tbx1tm208 homozygous mutants at 70 hpf. Loss of tbx1 results in a significant reduction in number of VICs and impacts the dextral (D) and sinistral (S) primordia equally (WT sibling, n = 13; tbx1tm208, n = 12). (G) and (G′): Mean ± S.E.M, Welch’s unpaired t-tests. ****, P < 0.0001; ns, not significant. V, ventricle; BA, bulbus arteriosus; D, dextral; S, sinistral. Scale bars: (A) and (B): 500 μm; (A′) and (B′): 50 μm; (C)–(D′): 20 μm; (E) and (F): 10 μm.

Acknowledgments
This image is the copyrighted work of the attributed author or publisher, and ZFIN has permission only to display this image to its users. Additional permissions should be obtained from the applicable author or publisher of the image. Full text @ Cardiovasc. Res.