
Image
|
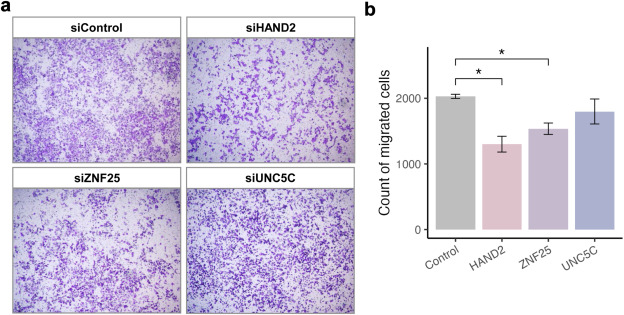
Figure Caption
Fig. 4 Transwell migration assay showing migration defects with downregulation of the HSCR-associated genes. (a) Representative images and quantification of the migrated cells are shown. (b) Number of migrated cells was counted in triplicates and is presented as mean ± standard error. Symbols denote the statistical significance of t-test (∗p < 0.05, ∗∗p < 0.01).
Acknowledgments
This image is the copyrighted work of the attributed author or publisher, and
ZFIN has permission only to display this image to its users.
Additional permissions should be obtained from the applicable author or publisher of the image.
Full text @ EBioMedicine