
|
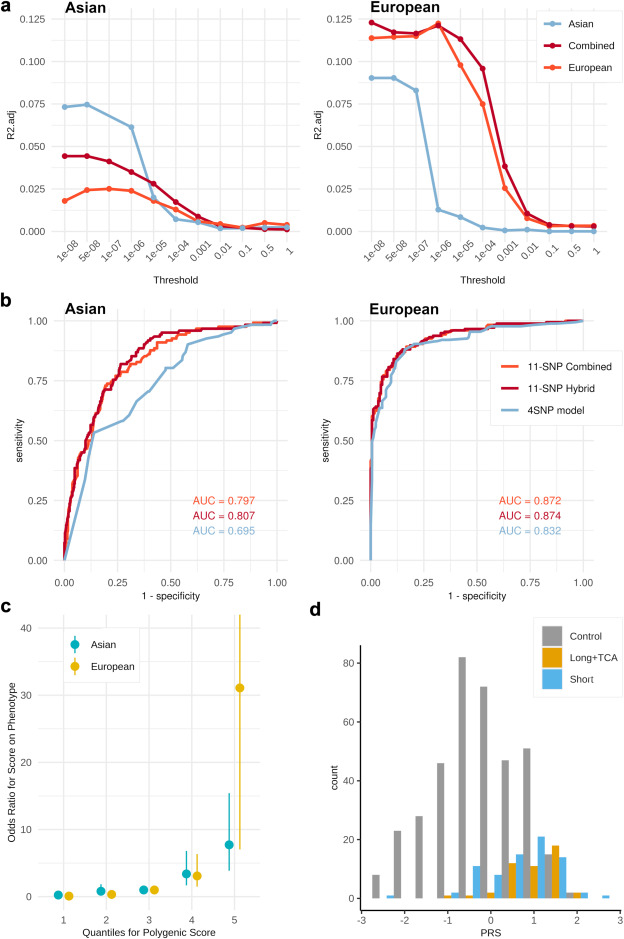
Fig. 6 Risk stratification of HSCR by global and ancestry-specific polygenic risk score. (a) Proportion of risk variance in Asian (left) and European (right) test samples explained by PRS derived from Asian, European or multi-ancestry training samples using C + T approach across different p-value thresholds, showing superior performance in European than in Asian test samples. R2adj refers to Lee's R2. (b) Receiver operating characteristic (ROC) curves of Asian (left) and European (right) test samples to evaluate the performance of the 4SNP model and the 11-SNP combined and hybrid PRS models derived from the multi-ancestry meta-analysis. Area under curve (AUC) of the models are shown. (c) Estimated odds ratios with 95% confidence intervals of HSCR in Asian and European test samples by PRS decile, relative to the 3rd decile for the 11-SNP combined PRS model. (d) Distribution of PRS of the 11-SNP combined PRS model for S-HSCR, L-HSCR and TCA samples relative to the controls.