
|
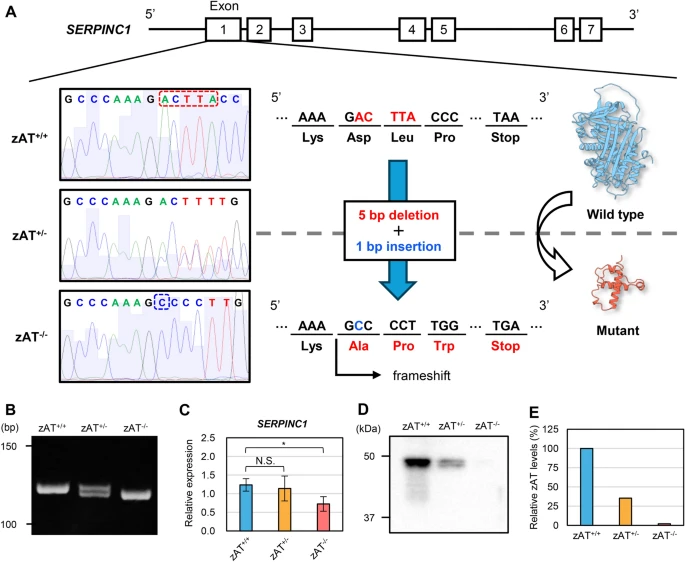
Fig. 1 Characterization of zAT mutant zebrafish demonstrating hereditary type I AT deficiency. (A) Sequencing analysis of exon 1 of the SERPINC1 gene in wild-type and zAT mutant zebrafish revealed the deletion of five bases (ACTTA; shown by the red dotted line), and the insertion of a single base (C; shown by the blue dotted line). Ribbon models illustrate the structural differences between the wild-type (blue ribbon) and mutant (red ribbon) zAT proteins as predicted by ColabFold. (B) Genotyping of zAT+/+, zAT+/−, and zAT−/− was performed by detecting a four-base deletion by Native-PAGE. (C) SERPINC1 mRNA levels showed no significant difference between zAT+/+ and zAT+/− (N.S., not significant; p = 0.37; n = 3), but were significantly lower in zAT−/− compared to zAT+/+ (p < 0.05; n = 3). (D, E) Detection and band quantification of zAT protein in zebrafish plasma by western blot analysis using an anti-zAT antibody.