
|
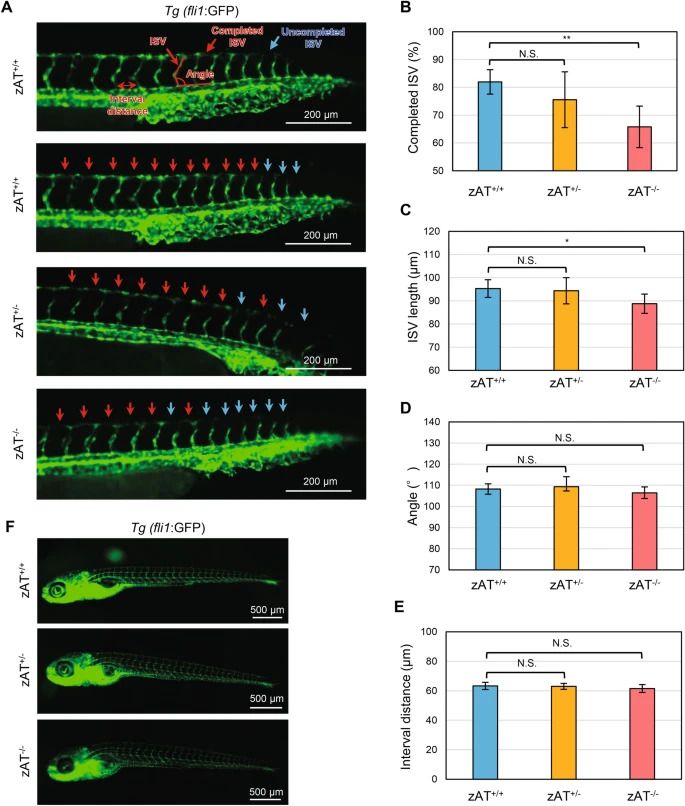
Fig. 3 Impact of severe zAT deficiency on vascular development. (A) Representative images of intersegmental vessel (ISV) development in zebrafish of different genotypes at 30 h post-fertilization (hpf). Red arrows indicate ISVs that have completed formation, while blue arrows indicate ISVs that have not yet completed formation. (B) Percentage of ISVs that have successfully completed formation across different genotypes. (C) Measurements of the length of ISVs in different genotypes. (D) Angle between each ISV and the dorsal aorta in different genotypes. (E) Distance between two adjacent ISVs in different genotypes. (F) Representative images at 5 days post-fertilization (dpf) showing overall vessel formation in different genotypes. Statistical significance is noted where applicable (N.S., not significant; **p < 0.01; *p < 0.05).