
Image
|
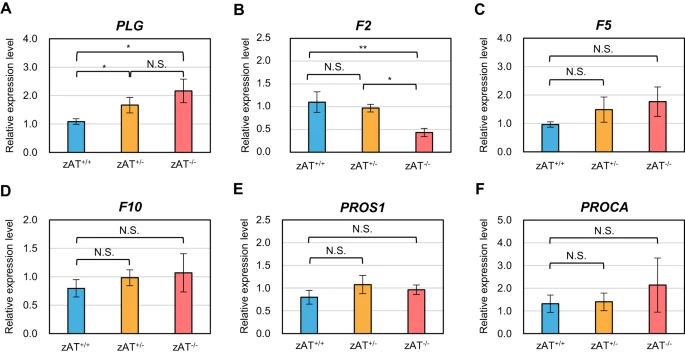
Figure Caption
Fig. 4 Gene expression analysis in juvenile zebrafish at 7 days post-fertilization (dpf) by quantitative real-time PCR. Gene expression levels of protein S (A), protein C (B), plasminogen (C), prothrombin (D), coagulation factor V (E), and coagulation factor X (F) were compared between wild-type and mutant zebrafish. N.S., not significant; **p < 0.01; *p < 0.05.
Acknowledgments
This image is the copyrighted work of the attributed author or publisher, and
ZFIN has permission only to display this image to its users.
Additional permissions should be obtained from the applicable author or publisher of the image.
Full text @ Sci. Rep.