
|
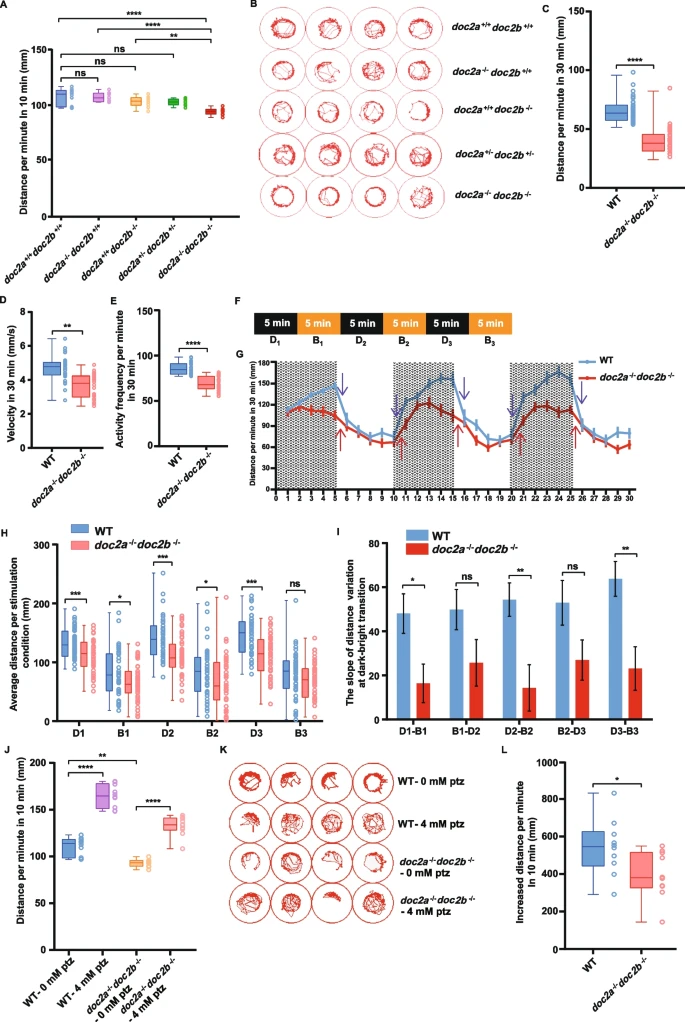
Fig. 3 Decreased locomotion of the doc2a−/−doc2b−/− larvae. A-E: Decreased locomotion activity of the doc2a−/−doc2b−/− larvae in the locomotion activity test. Multiple comparison of distance traveled by the WT (n = 19), doc2a−/− (n = 21), the doc2b−/− (n = 25), doc2a+/-doc2b+/- (n = 90), and doc2a−/−doc2b−/− (n = 17) larvae per minute in the first 10 min at 5 dpf (A). Representative diagrams of motion trajectory from the WT, doc2a−/−, doc2b−/−, doc2a+/-doc2b+/-, and doc2a−/−doc2b−/− larvae in the first 10 min at 5 dpf. The res circle represented the edge of the well in the 96-well plate and the trace of zebrafish was located right in the center of the red circle (B). Comparison of distance traveled by the WT and the doc2a−/−doc2b−/− per minute in the total 30 min (C). Comparison of velocity between the WT and the doc2a−/−doc2b−/− at 5 dpf per second in the total 30 min (D). Comparison of activity frequency between the WT and the doc2a−/−doc2b−/− per minute in the total 30 min (E). F-I: Impaired locomotion activity of the doc2a−/−doc2b−/− larvae in the light/dark test. The time scale of Dark/Bright cycles: The activity was recorded under three 5-min dark/light transition stimulations (D1/B1, D2/B2, D3/B3) (F). The average distance traveled by the WT (n = 47) and doc2a−/−doc2b−/− (n = 47) larvae at 5 dpf per minute in 30 min. Purple arrows and red arrows indicate the slope variation at dark/light transitions in the WT and doc2a−/−doc2b−/− larvae at 5 dpf (G). Comparison of distance traveled by the WT and the doc2a−/−doc2b−/− in each dark condition or bright condition (H). Comparison of the slope variation in the WT and the doc2a−/−doc2b−/− at dark/bright transitions (I). J-L: Anti-seizure phenotype in the doc2a−/−doc2b−/− larvae at 5 dpf. Multiple comparisons of distance traveled by the WT (n = 17) and doc2a−/−doc2b−/− (n = 19) larvae at 5 dpf per minute in 10 min with or without 4 mM PTZ treatment (J). Representative diagrams of motion trajectory of the WT and doc2a−/−doc2b−/− larvae at 5 dpf with or without 4 mM PTZ treatment (K). Comparison of increased distance traveled by the WT and doc2a−/−doc2b−/− larvae at 5 dpf after 4 mM PTZ treatment (L). Statistical significance was determined by one-way ANOVA, Tukey’s test (A, J), or by two-tailed Student’s t-test (C, D, E, H, I, L); data were combined from three biological replicates; mean ± SE; *, P < 0.05; **, P < 0.01; ***, P < 0.001; ****, P < 0.0001; ns, no significance