
|
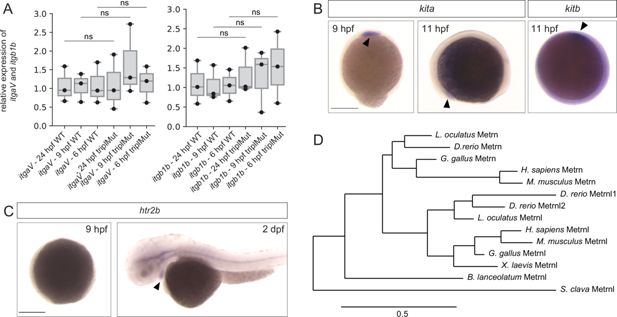
Fig. 6 - Supplemental 2 Kita, kitb, and htr2b expression patterns during early zebrafish development. (A) qRT-PCR analysis for itgaV and itgb1b expression in 6 hpf, 9 hpf, and 24 hpf wild type (WT) and triplMut embryos (Fisher exact tests, n.s.=non-significant, p-values: 0.95 for 24 hpf itgaV WT vs. itgaV triplMut, 0.37 for 9 hpf itgaV WT vs. itgaV triplMut, 0.92 for 6 hpf itgaV WT vs. itgaV triplMut, 0.64 for 24 hpf itgb1b WT vs. itgb1b triplMut, 0.7 for 9 hpf itgb1b WT vs. itgb1b triplMut, 0.46 for 6 hpf itgb1b WT vs. itgb1b triplMut). Error bars indicate standard deviation. (B) At 9 hpf, kita is expressed in the prechordal plate (black arrowhead, dorsal view) and from 11 hpf in the lateral borders of the anterior neural plate (black arrowhead, lateral view). Kitb expression could be detected from 11 hpf in the anterior ventral mesoderm (black arrowhead, lateral view). (C) At 9 hpf, htr2b is not yet expressed. From 2 days post-fertilization (dpf), htr2b transcripts could be detected in the developing heart (black arrowhead, lateral views). (D) Phylogenetic tree of Metrn proteins. (Scale bar indicates number of amino acids substitutions per site). Scale bars: in (B – C) 250 μm. Source data for Figure 6—figure supplement 2A provided in ‘Figure 6—figure supplement 2—source data 1’.