
|
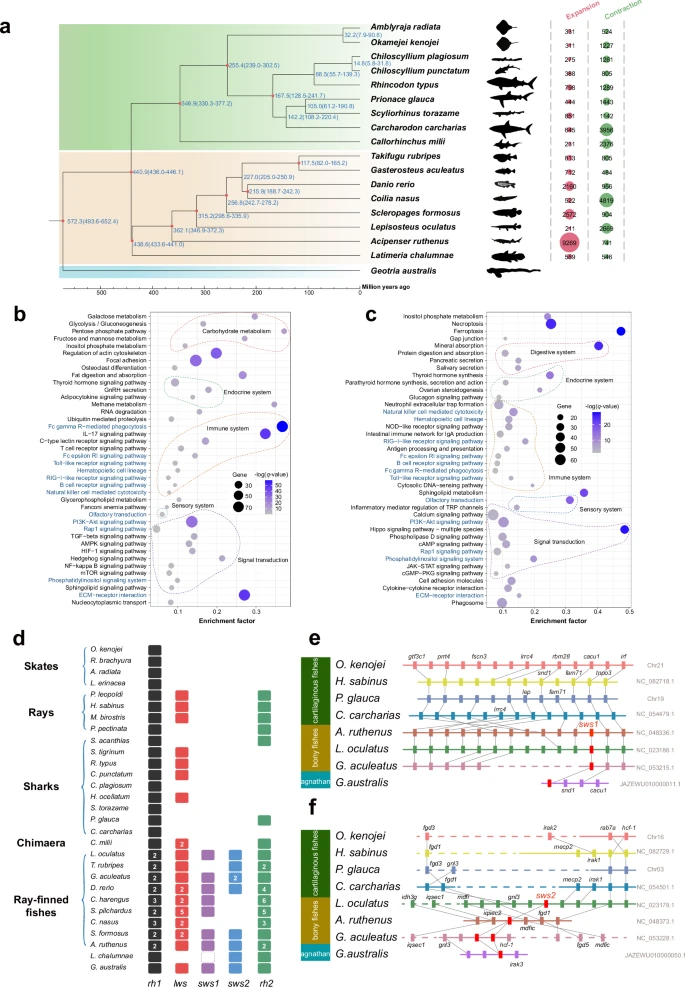
Fig. 2 Phylogeny and comparative genomics of cartilaginous fishes. a Phylogenetic and gene family expansion and contraction analysis of O. kenojei and P. glauca. b, c KEGG pathway enrichment analysis of expanded genes in O. kenojei (b) and P. glauca (c). Top 40 enriched pathways are shown; the pathways labeled in blue are shared by both species. d Orthology catalog for opsins in cartilaginous fishes. The numbers in the boxes are paralog numbers; the dashed box represents a pseudogene. e, f Loss of sws1 (e) and sws2 (f) in cartilaginous fishes, respectively. Synteny of genes around sws1 and sws2 is illustrated using gray bands connecting the orthologs across species (The dashed lines indicate that these two genes are not adjacent on the scaffold or chromosome).