
|
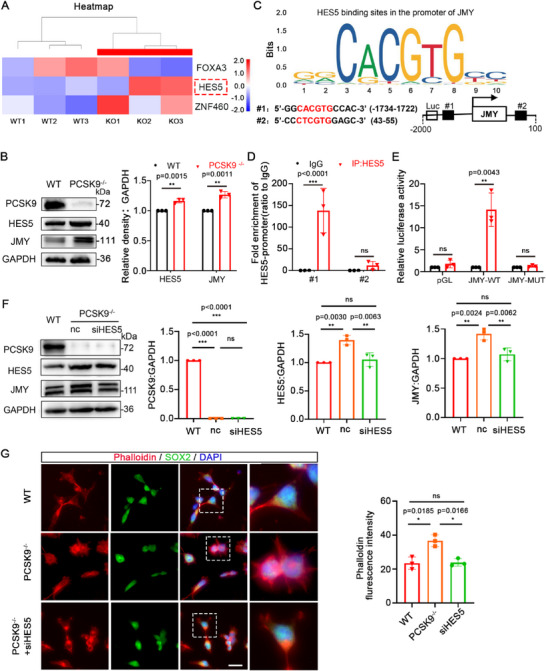
Figure 4
HES5 acts as a transcription factor and regulates JMY expression. A) Heat map of FOXA3, HES5, and ZNF460 expression levels in the transcriptome database. The three rows on the left pertain to the WT groups, and the three on the right to the PCSK9‐/‐ groups. Red indicates high expression, and blue indicates low expression. B) WB and quantification of PCSK9, HES5, and JMY protein levels in WT and PCSK9‐/‐NOs; n = 3 independent experiments. C) Prediction of HES5–JMY binding sites. D) ChIP‐qPCR analysis of HES5 enrichment at two sites of the JMY promoter; n = 3 individual experiments. E) Luciferase reporter gene experiments verified that HES5 exhibits transcriptional activity against JMY; n = 3 individual experiments. F) WB and quantification of PCSK9, HES5, and JMY protein levels in NPCs after siHES5 rescue experiments; n = 3 individual experiments. G) Immunofluorescence staining and fluorescence intensity quantification of cell microfilaments in WT and PCSK9‐/‐ NPCs with and without siHES5 rescue; n = 3 plates from WT, PCSK9‐/‐, and PCSK9‐/‐ +siHES5; scale bar, 20 µm. Values were mean ± SD. Statistical significance was determined using an unpaired two‐tailed Student's