IMAGE

Figure 6

ID
ZDB-IMAGE-260101-75
Genes
Source
Figures for Che et al., 2025
Image
Figure Caption

Figure 6

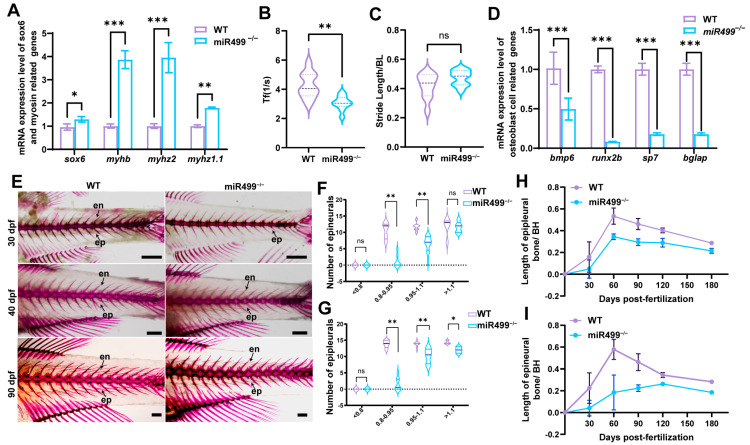
miR499 deficiency delays IBs ossification and modulates muscle gene expression and locomotion. (A) qPCR analysis of sox6 and myosin-related genes in muscle tissues of WT and miR499−/− zebrafish at 30 dpf. (B,C) Tail-beat frequency and (C) stride length of WT and miR499−/− zebrafish at 30 dpf. Tf: Tail-beat frequency, Stride length was normalized by Body Length. (D) qPCR analysis of osteogenic genes in muscle tissues of WT and miR499−/− zebrafish at 30 dpf. (E) Alizarin red staining of IBs in WT and miR499−/− zebrafish at 30, 40, and 90 dpf. Scale bars = 1 mm. Arrows represent IBs. en: epineural bone; ep: epipleural bone. (F,G) Quantification of epineural bone (F) and epipleural bone (G) in WT and miR499−/− zebrafish across different body length ranges at 30 dpf. (H,I) Ossification rate of two IBs epineural bone and epipleural bone in miR499−/− mutant and WT. The relative length of IBs was calculated as: Relative length = Length of (epineural/epipleural bones)/Body length (BL). Growth rate curves of IBs were plotted based on these relative lengths across developmental stages. N = 3. * p < 0.05, ** p < 0.01, *** p < 0.001. ns: no significance.

Figure Data
Acknowledgments
This image is the copyrighted work of the attributed author or publisher, and ZFIN has permission only to display this image to its users. Additional permissions should be obtained from the applicable author or publisher of the image. Full text @ Biology (Basel)