
|
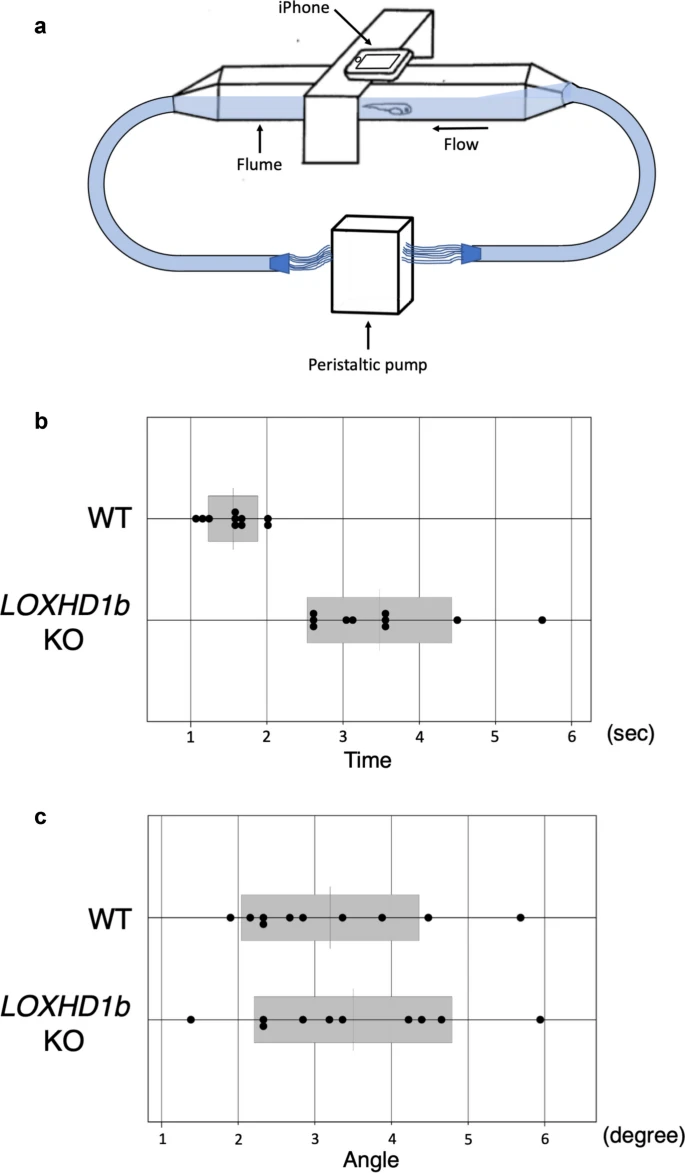
Fig. 5 Quantitative analysis of rheotaxis. (a) We created a clear plastic, rectangular parallel-piped flume to test rheotaxis. Zebrafish 5dpf larva was placed in the observation chamber, and its movement and heading angle were recorded. (b) Measurement of response time under water load. Rheotaxis was investigated by applying water load to WT and KO zebrafish. The flow sensing time was measured and compared using the t-test. There was a significant difference in flow sensing time between the two groups (P = 0.008). (c) Analysis of angle to water flow. The angle of zebrafish to water flow was measured and compared using the t-test. There was no significant difference between the two groups (P = 0.59129)