IMAGE

FIGURE 3

ID
ZDB-IMAGE-260210-183
Source
Figures for Patraskaki et al., 2026
Image
Figure Caption

FIGURE 3

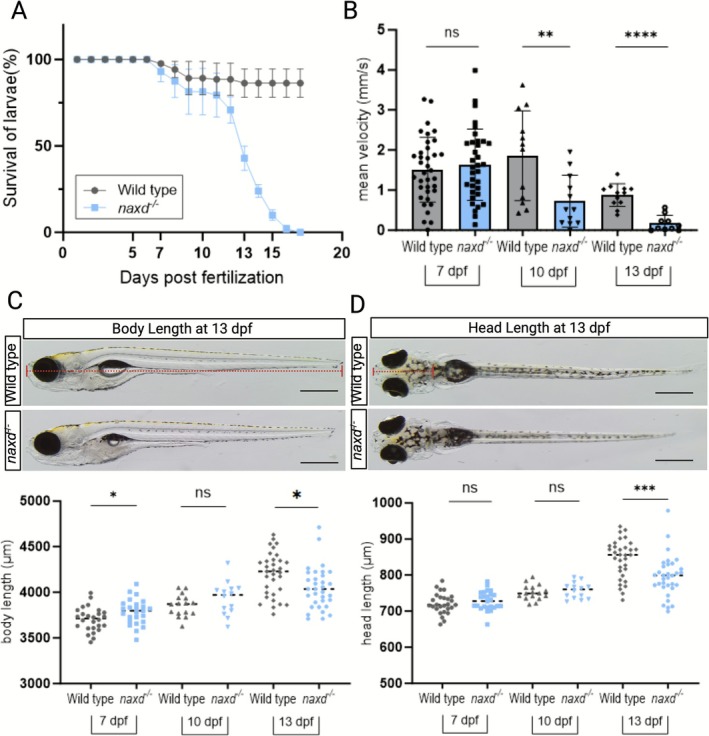
Survival, locomotion, and size analyses in WT and naxd−/− larvae. (A) Survival analysis over 20 days. Data are means ± SDs of three independent survival experiments starting with n = 20–50 larvae per genotype. (B) Locomotion behavior at the indicated time points. Scatter bar plots represent means ± SDs of the mean velocity calculated after continuous tracking for 30 min in light conditions (50% light intensity); each dot represents one larva (7 dpf, n = 36 per genotype; 10 and 13 dpf, n = 10–12 per genotype). (C, D) Representative images of WT and naxd−/− larvae at 13 dpf in lateral and dorsal view. The scale bars represent 500 μm. Body length (red dotted line in (C)) and head length (red dotted line in (D)) were calculated with the Olympus cellSens Entry software (version 4.1.1). Bottom panels show individual values for the indicated time points, each dot representing one larva (n = 25–40 per genotype and time point); horizontal lines correspond to mean values. Statistical significance was determined with unpaired t‐tests (*p ≤ 0.05, **p ≤ 0.01, and ***p ≤ 0.001; ns, not significant).

Figure Data
Acknowledgments
This image is the copyrighted work of the attributed author or publisher, and ZFIN has permission only to display this image to its users. Additional permissions should be obtained from the applicable author or publisher of the image. Full text @ J. Inherit. Metab. Dis.