
|
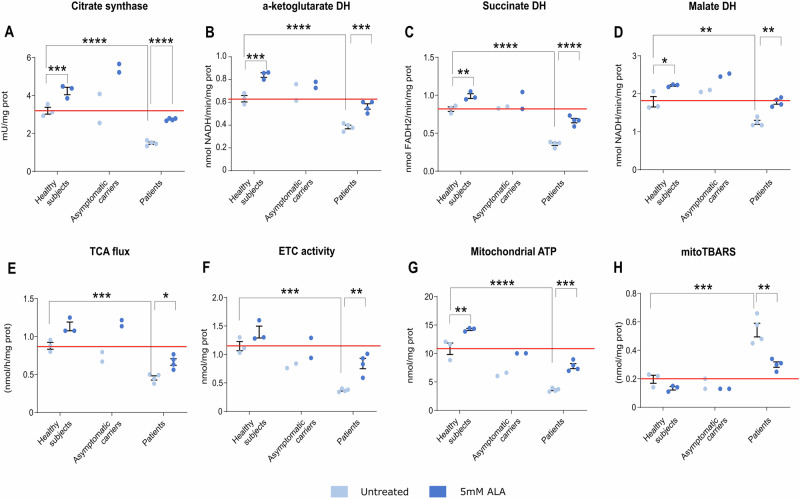
Fig. 7 Primary fibroblasts derived from 4 patients carrying distinct pathogenetic variants in the FLVCR1 gene (P1-P3-P6 and P7), from 3 healthy individuals (C1, C2, and C3) and from 2 asymptomatic carriers (HET1 and HET2) were used. Primary fibroblasts were treated for 16 hours with 5 mM δ-aminolevulinic acid (ALA) alone to restore heme synthesis. Each dot in the graphs represents a biological replicate. Error bars in the graphs denote the standard error of the mean (SEM). A Citrate synthase activity upon ALA treatment. B α-ketoglutarate dehydrogenase activity upon ALA treatment. C Succinate dehydrogenase activity upon ALA treatment. D Malate dehydrogenase activity upon ALA treatment. E TCA cycle flux measurement upon ALA treatment. F Total activity of the ETC measured as nmol of reduced cytochrome C /minute upon ALA treatment. G Mitochondria ATP content upon ALA treatment. H Measurement of mitochondrial Thiobarbituric Acid Reactive Substance (TBARS) as an index of lipid peroxidation upon ALA treatment. A–H n = 3 biological replicates for healthy individuals; n = 2 biological replicates for asymptomatic carriers; n = 4 biological replicates for patients. Two-way ANOVA analysis of variance was performed to compare healthy individuals and patients. * = P < 0.5; ** = P < 0.01; ***P = < 0.001; ****P = 0.0001.