IMAGE

Fig. 4

ID
ZDB-IMAGE-260416-66
Genes
Publication
Coppola et al., 2025 - Zebrafish as a model for Catel-Manzke syndrome-identification and characterization of the zebrafish TGDS ortholog
All Figures
Figures for Coppola et al., 2025
Image
Figure Caption

Fig. 4

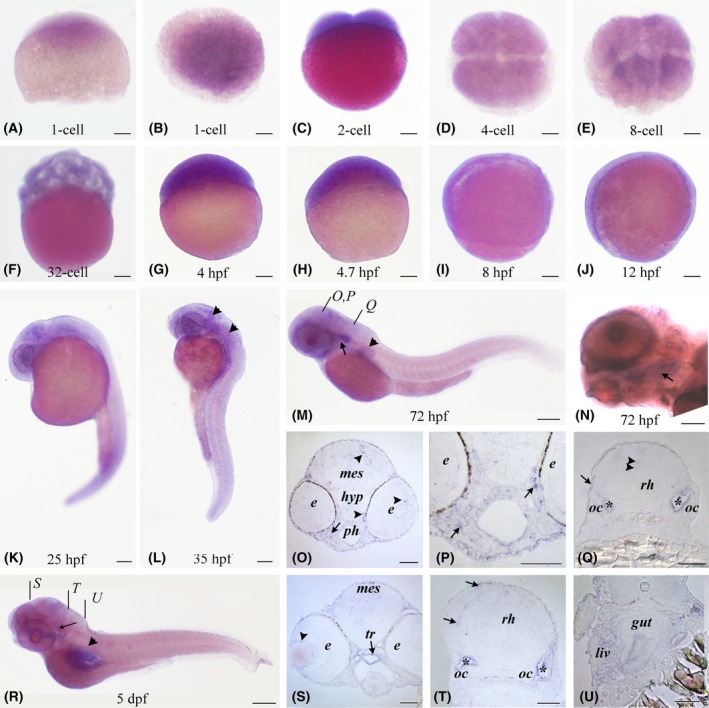
Analysis of tgds expression in developing zebrafish by in situ hybridization. (A–J) Early stages showing tgds expression in the whole embryo. A and B, 1‐cell side and animal dorsal views, respectively. (D, E) Embryos in animal view. (C, F–J) Side views of embryos. (K–M) Late embryonic stages show diffuse expression in the mesencephalic and rhombencephalic regions (arrowheads in L) as well as in the pectoral fin (arrowhead in M) and otic capsule (arrow in M). From 72 hpf, transcripts are also found in the branchial region (arrows in N and R). (N) Enlarged view of the head showing tgds expression in the region of the branchial arches (arrow). (O–Q) Sections at the levels indicated in panel M, showing tgds expression in some cells of the eye and mesencephalon (arrowheads) and in the mesenchyme of the pharyngeal region (arrows in O and P). More posteriorly (Q), tgds is expressed in the otic capsules (asterisks), scattered cells of the rhombencephalon (arrowheads), and ectoderm (arrow). (R) Early larval stage (5 dpf). (S–U) Sections at the levels indicated in panel R. In R, tgds expression is visible in the trabecular cartilage (arrow) and in the region of the gut and liver (arrowhead), in the trabecular cartilage (arrow) and the (S) tgds is expressed in the lens capsule (arrowhead), in the trabecular cartilage (arrow) and associated epithelium, and in scattered cells of the mesencephalon. (T) tgds expression is found in the otic capsules (asterisks) as well as in the cells of the rhombencephalon (arrow). (U) tgds transcripts are detected in the gut and liver. Scale bars are 100 μm for whole mounts and 50 μm for sections. e, eye; hyp, hypothalamus; liv, liver; mes, mesencephalon; oc, otic capsule; ph, pharynx; rh, rhombencephalon; tr, trabecular cartilage. Images are representative of three independent ISH experiments.

Figure Data
Acknowledgments
This image is the copyrighted work of the attributed author or publisher, and ZFIN has permission only to display this image to its users. Additional permissions should be obtained from the applicable author or publisher of the image. Full text @ FEBS J.