IMAGE

Fig. 5

ID
ZDB-IMAGE-260416-67
Publication
Coppola et al., 2025 - Zebrafish as a model for Catel-Manzke syndrome-identification and characterization of the zebrafish TGDS ortholog
All Figures
Figures for Coppola et al., 2025
Image
Figure Caption

Fig. 5

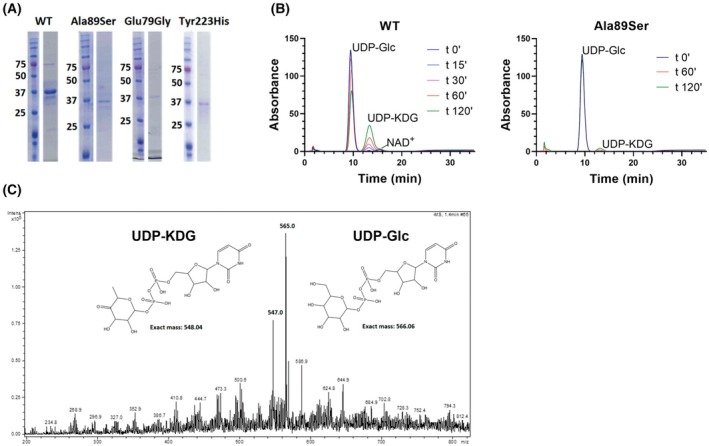
Enzymatic activity and stability of the recombinant WT and mutant Tgds proteins. (A) Representative SDS/PAGE analysis of the WT and mutant Tgds expressed in E. coli and purified using a N‐terminal 6XHis tag. (B) Enzymatic activity of recombinant WT and Ala89Ser recombinant proteins, assessed through an in vitro assay monitored by anion exchange HPLC. The incubation of WT Tgds with its substrate, UDP‐D‐Glc, resulted in a time‐dependent conversion to the product, UDP‐4‐keto‐6‐deoxy‐D‐Glc (UDP‐KDG), as evidenced by the progressive decrease in the UDP‐D‐Glc peak and the corresponding increase in the UDP‐KDG peak over time. A minor peak corresponding to NAD+ is also present, likely due to the release of this tightly bound cofactor from the protein during the denaturation step prior to the HPLC analysis. The retention times of the substrate and product were confirmed using the recombinant T. vaginalis UDP‐D‐Glc 4,6 dehydratase [17]. To investigate the role of a specific amino acid residue, the Ala89Ser mutant of Tgds was tested in parallel under identical conditions as the WT enzyme in panel A. HPLC analysis of the reaction with the mutant enzyme is shown, allowing direct comparison of its activity to that of the WT protein. The rate of conversion was determined by measuring the decrease in the UDP‐D‐Glc peak area over the analyzed time range, which exhibited a linear relationship. The data presented in these figures are representative of a single experiment. The cumulative results obtained from three different batches of the recombinant proteins are reported in Table 1. (C) ESI‐MS analysis of UDP‐D‐Glc (m/z 565.05) tested after incubation with WT Tgds; the peak at 547.04 corresponds to the expected m/z of the dehydration product, UDP‐KDG. A representative mass spectrum from one of two independent analyses is presented.

Acknowledgments
This image is the copyrighted work of the attributed author or publisher, and ZFIN has permission only to display this image to its users. Additional permissions should be obtained from the applicable author or publisher of the image. Full text @ FEBS J.