
|
Figure 7
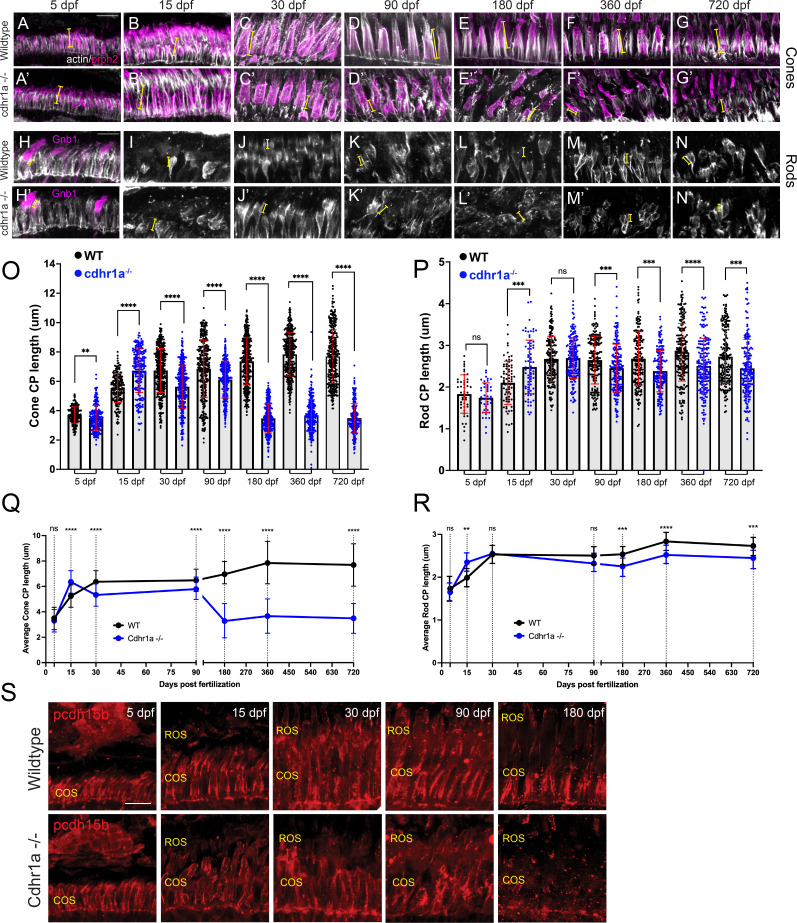
Calyceal processes in cones are disorganized in the absence of cdhr1a function.
(A–G) Confocal microscopy of wildtype retinal cryosections probed with PNA (magenta) and actin-antibodies (white) at various timepoints detecting cone CPs. Typical length of CPs observed is demonstrated by yellow lines. Scale bar = 5 μm. (A’-G’) Confocal microscopy of cdhr1a-/- retinal cryosections probed with actin-antibodies (white) at various timepoints detecting cone CPs. Typical length of CPs observed is demonstrated in magenta. (H–N) Confocal microscopy of wildtype retinal cryosections probed with actin-antibodies (white) and gnb1 (A’) (magenta) at various timepoints detecting rod CPs. Typical length of CPs observed is demonstrated in yellow. (H’-N’) Confocal microscopy of cdhr1a-/- retinal cryosections probed with actin-antibodies (white) and gnb1 (F’) (magenta) at various timepoints detecting rod CPs. Typical length of CPs observed is demonstrated by yellow lines. Scale bar = 5 μm. ROS = cone outer segment layer. (O) Quantification of cone cells CP length based on measurements of actin staining in wildtype (black) compared to cdhr1a-/- (blue) at 5, 15, 30, 90, 180, 360, and 720 dpf. Standard deviation is shown in red. **=p < 0.01, ****=p < 0.0001. (P) Quantification of rod cells CP length based on measurements of actin staining in wildtype (black) compared to cdhr1a-/- (blue) at 5, 15, 30, 90, 180, 360, and 720 dpf. Standard deviation is shown in red. ns = not significant, ***=p < 0.001, ****=p < 0.0001. (Q) Line graph depicting the long-term trend of cone cells CP length changes between wildtype (black) and cdhr1a-/- (blue) over time. **=p < 0.01, ****=p < 0.0001. (R) Line graph depicting the long-term trend of rod cells CP length changes between wildtype (black) and cdhr1a-/- (blue) over time. ns = not significant, ***=p < 0.001, ****=p < 0.0001. (S) Confocal microscopy of wildtype (top panels) and cdhr1a-/- (bottom panels) retinal cryosections probed with pcdh15b antibody (red) at various timepoints. Scale bar = 5 μm. COS = cone outer segment layer, ROS = rod outer segment layer.