Figure Caption
Fig. 9
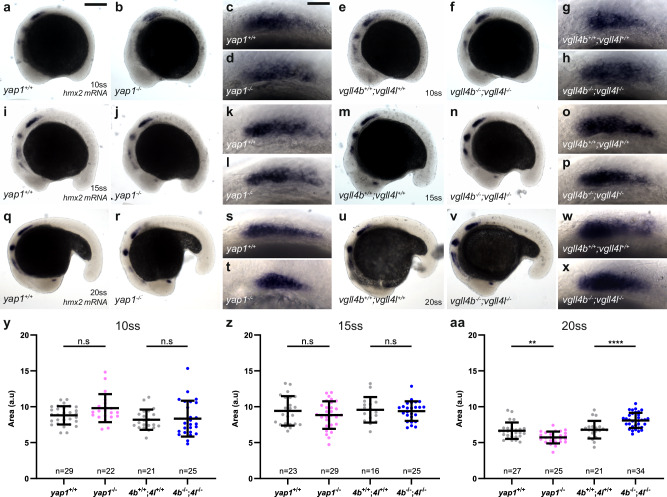
pLLP size changes in yap1 and vgll4 mutants emerge between 15ss and 20ss.
Overview (a, b, e, f, i, j, m, n, q, r, u, v) and higher magnification images (c, d, g, h, k, l,o, p, s, t, w, x) taken on a brightfield microscope of yap1+/+ (a, c, i, k, q, s), yap1−/− (b, d, j, l, r, t), vgll4b+/+;vgll4l+/+ (e, g, m, o, u, w), and vgll4b−/−;vgll4l−/− (f, h, n, p, v, x) embryos stained by ISH for hmx2 at 10ss (14 hpf) (a–h), 15ss (16.5 hpf) (i–p), and 20ss (19 hpf) (q–x). Quantifications of hmx2 stained area in each indicated group at 10ss (y), 15ss (z), and 20ss (aa) (N = 1 independent replicate). Data are presented as mean ± SD. Unpaired t-tests (Mann–Whitney) were conducted. Scale bar: 400 μm (a, b, e, f, i, j, m, n, q, r, u, v), 20 μm (c, d, g, h, k, l, o, p, s, t, w, x).
Acknowledgments
This image is the copyrighted work of the attributed author or publisher, and
ZFIN has permission only to display this image to its users.
Additional permissions should be obtained from the applicable author or publisher of the image.
Full text @ Commun Biol