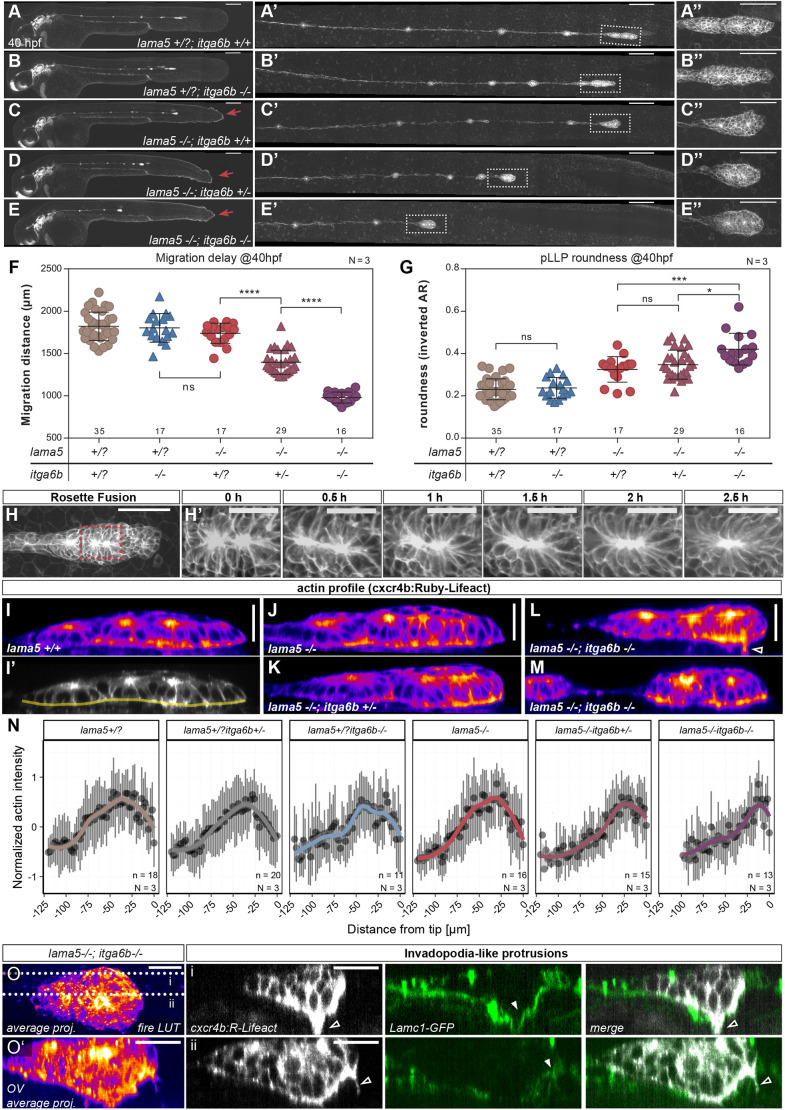
lama5 and itga6b interact genetically to maintain pLLP migration. (A-E″) lama5;itga6b at 40 hpf. Compared to controls (A-A″) and single mutants (B-C″), pLLP migration is impaired in lama5−/−;itga6b+/− mutants (D-D″) and even more severely in lama5−/−;itga6b−/− (E-E″). (F) Quantification of the distance migrated by the pLLP at 40 hpf. (G) Quantification of the increased roundness in compound mutants (higher magnifications of the pLLP shown in A″-E″). (H,H′) Example of a rosette fusion event in a lama5−/−;itga6b−/− mutant pLLP. (I-M) Supracellular actin distribution in lama5 and lama5;itga6b mutants, shown are sum-projected digital sections. (N) Normalized actin signal along the basal side of the pLLP (shown in I′). Dots indicate mean values per 2 µm bin; bars indicate data range; line indicates loess model. (O,O′) Example of invadopodia-like protrusions in lama5−/−;itga6b−/− with digital sections indicated in O (i,ii) demonstrating penetration through BM holes (arrowheads). Sample sizes (n) are indicated above the x-axes. N is the number of biological replicates. One-way ANOVA with multiple comparisons (dots indicate individual embryos; bars indicate mean±s.d. ns, non-significant. *P<0.05; ***P<0.001; ****P<0.0001. Scale bars: 200 μm in A-E; 100 μm in A′-E′; 50 μm in A″-E″,H; 20 μm in I-M,O,O′; 10 μm in H′.
Acknowledgments
This image is the copyrighted work of the attributed author or publisher, and
ZFIN has permission only to display this image to its users.
Additional permissions should be obtained from the applicable author or publisher of the image.
Full text @ Development
Your Input Welcome
Thank you for submitting comments. Your input has been emailed to ZFIN curators who may contact you if
additional information is required.
Oops. Something went wrong. Please try again later.