
Fig. 6
- ID
- ZDB-IMAGE-260624-87
- Genes
- Publication
- Mertens et al., 2026 - Laminin α5 and integrins α3 and α6 coordinately regulate collective cell migration in vivo
- All Figures
- Figures for Mertens et al., 2026
|
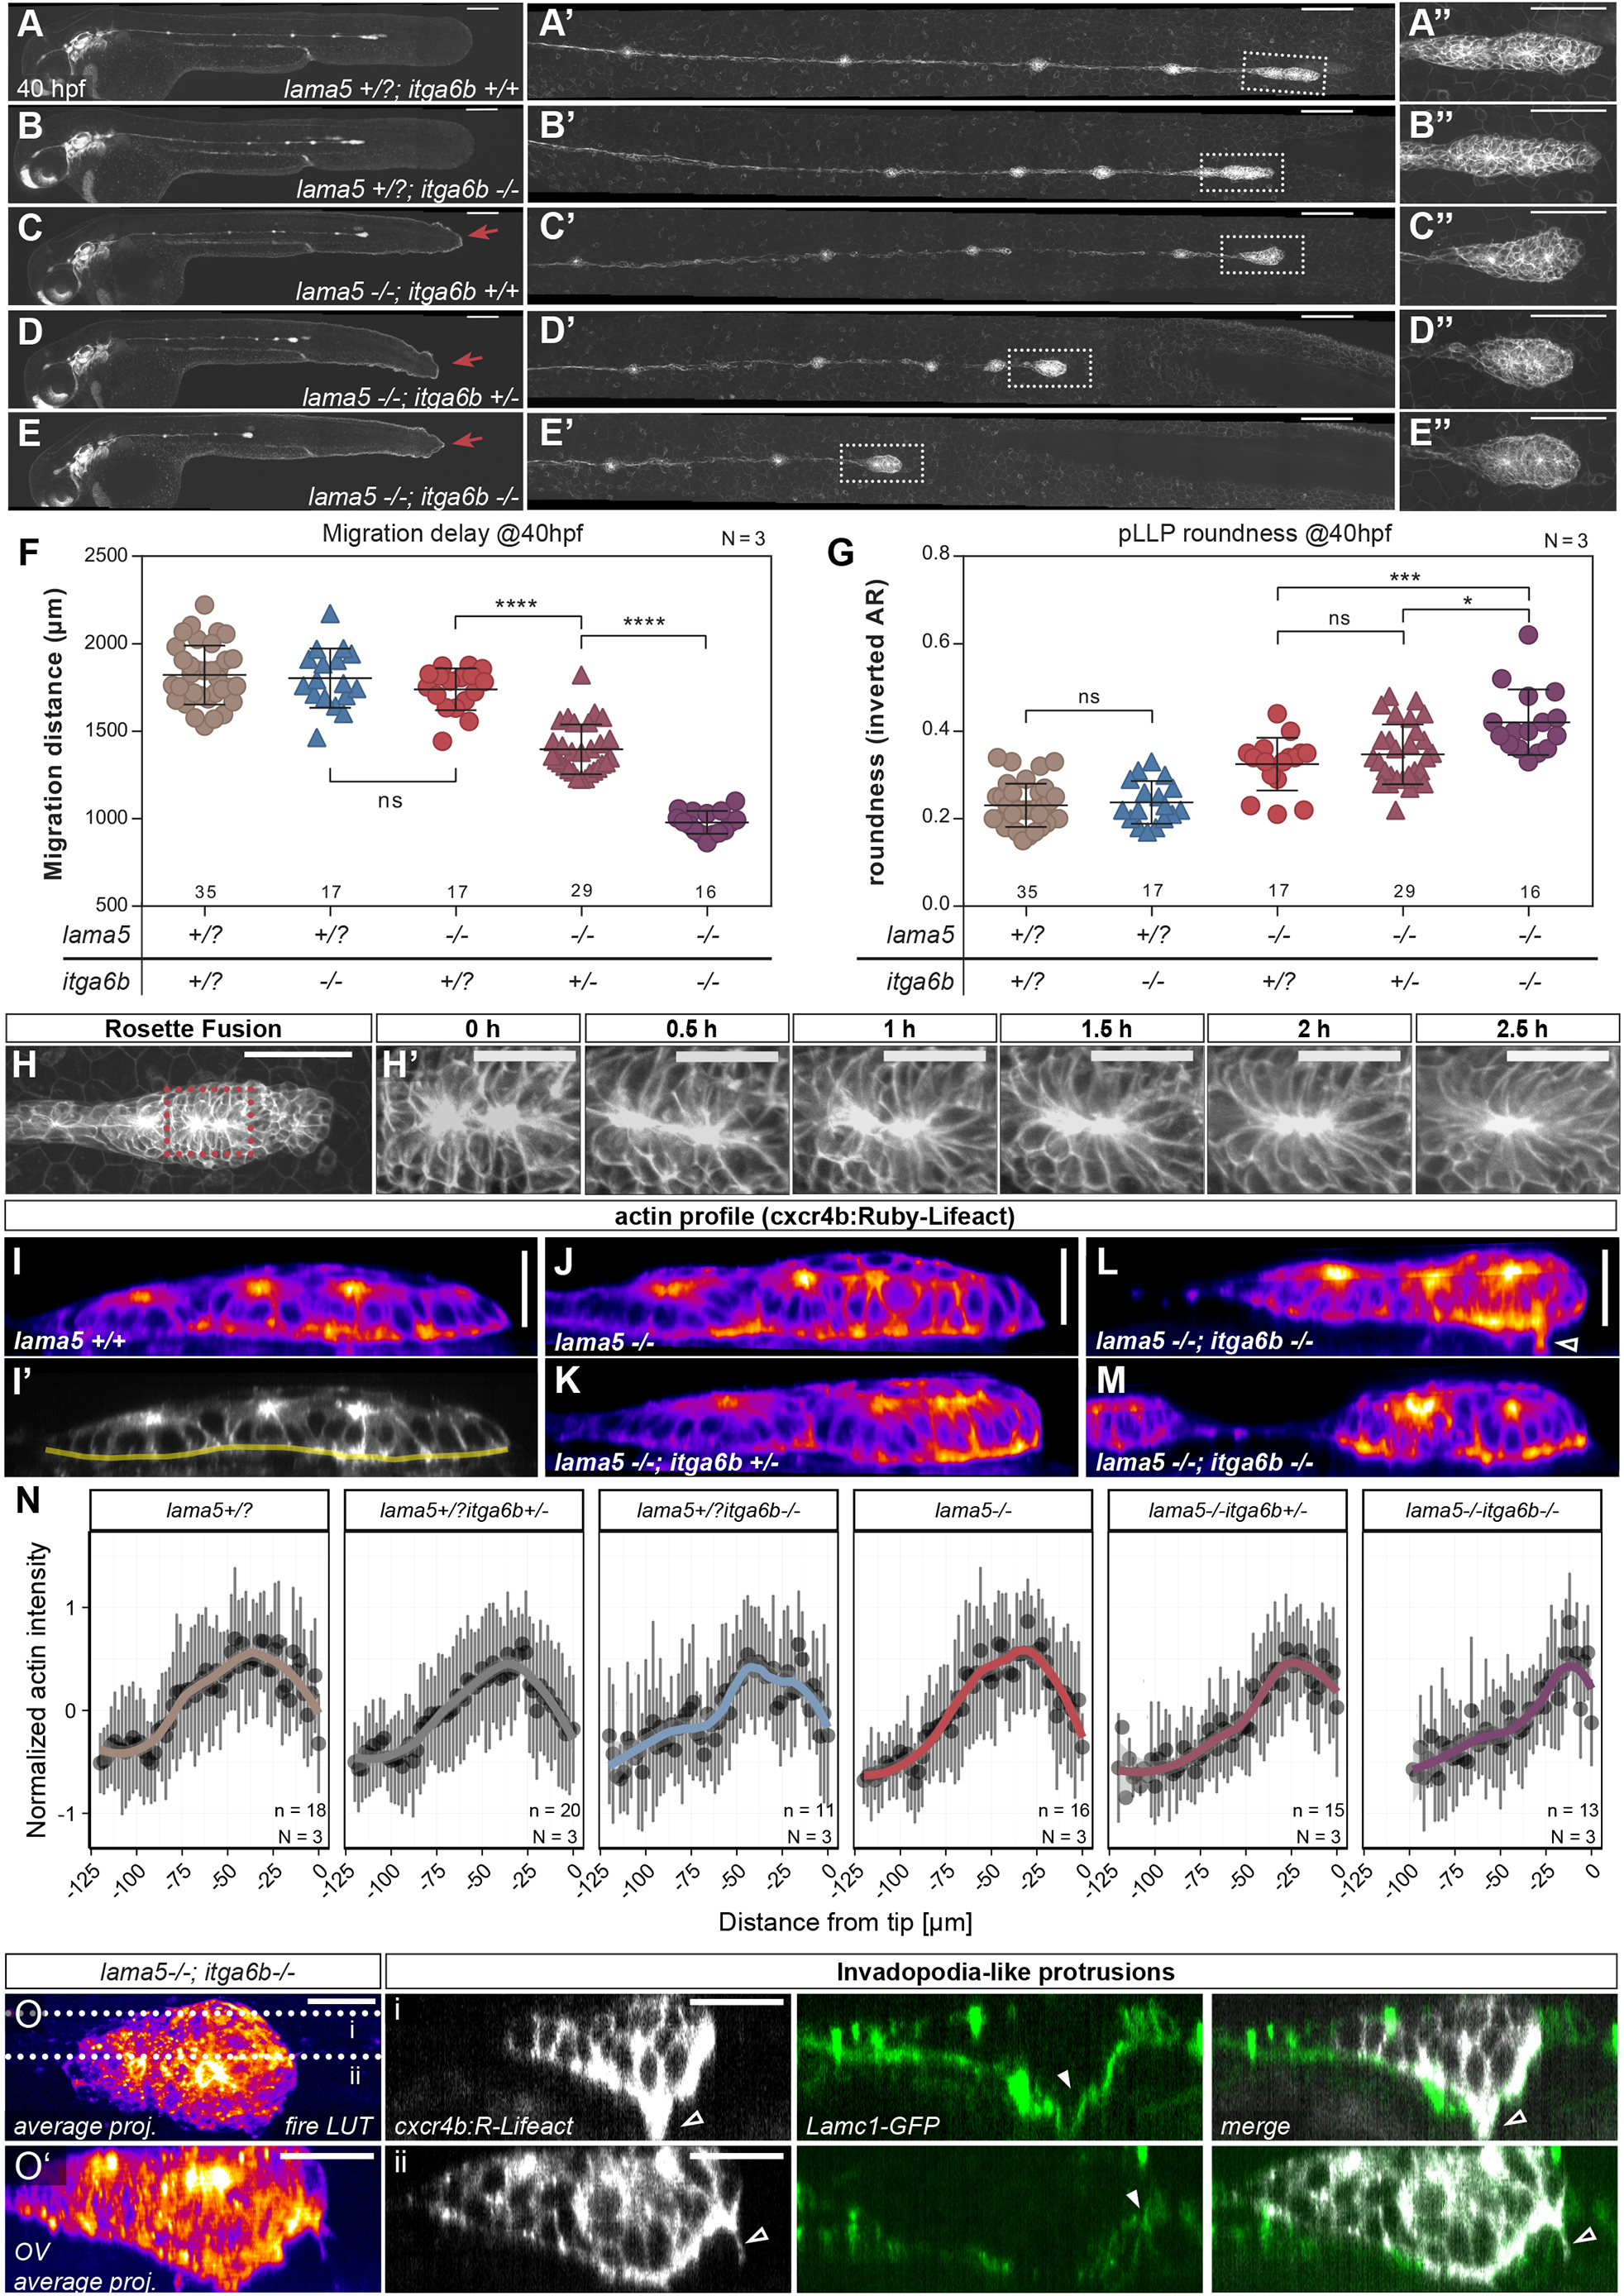
Fig. 6 lama5 and itga6b interact genetically to maintain pLLP migration. (A-E″) lama5;itga6b at 40 hpf. Compared to controls (A-A″) and single mutants (B-C″), pLLP migration is impaired in lama5−/−;itga6b+/− mutants (D-D″) and even more severely in lama5−/−;itga6b−/− (E-E″). (F) Quantification of the distance migrated by the pLLP at 40 hpf. (G) Quantification of the increased roundness in compound mutants (higher magnifications of the pLLP shown in A″-E″). (H,H′) Example of a rosette fusion event in a lama5−/−;itga6b−/− mutant pLLP. (I-M) Supracellular actin distribution in lama5 and lama5;itga6b mutants, shown are sum-projected digital sections. (N) Normalized actin signal along the basal side of the pLLP (shown in I′). Dots indicate mean values per 2 µm bin; bars indicate data range; line indicates loess model. (O,O′) Example of invadopodia-like protrusions in lama5−/−;itga6b−/− with digital sections indicated in O (i,ii) demonstrating penetration through BM holes (arrowheads). Sample sizes (n) are indicated above the x-axes. N is the number of biological replicates. One-way ANOVA with multiple comparisons (dots indicate individual embryos; bars indicate mean±s.d. ns, non-significant. *P<0.05; ***P<0.001; ****P<0.0001. Scale bars: 200 μm in A-E; 100 μm in A′-E′; 50 μm in A″-E″,H; 20 μm in I-M,O,O′; 10 μm in H′.