
IMAGE
Fig. 3
- ID
- ZDB-IMAGE-260729-76
- Genes
- Publication
- Geng et al., 2026 - Expression Analysis of the TMC Gene Family in the Auditory System During Zebrafish Embryonic Development
- All Figures
- Figures for Geng et al., 2026
Image
|
Figure Caption
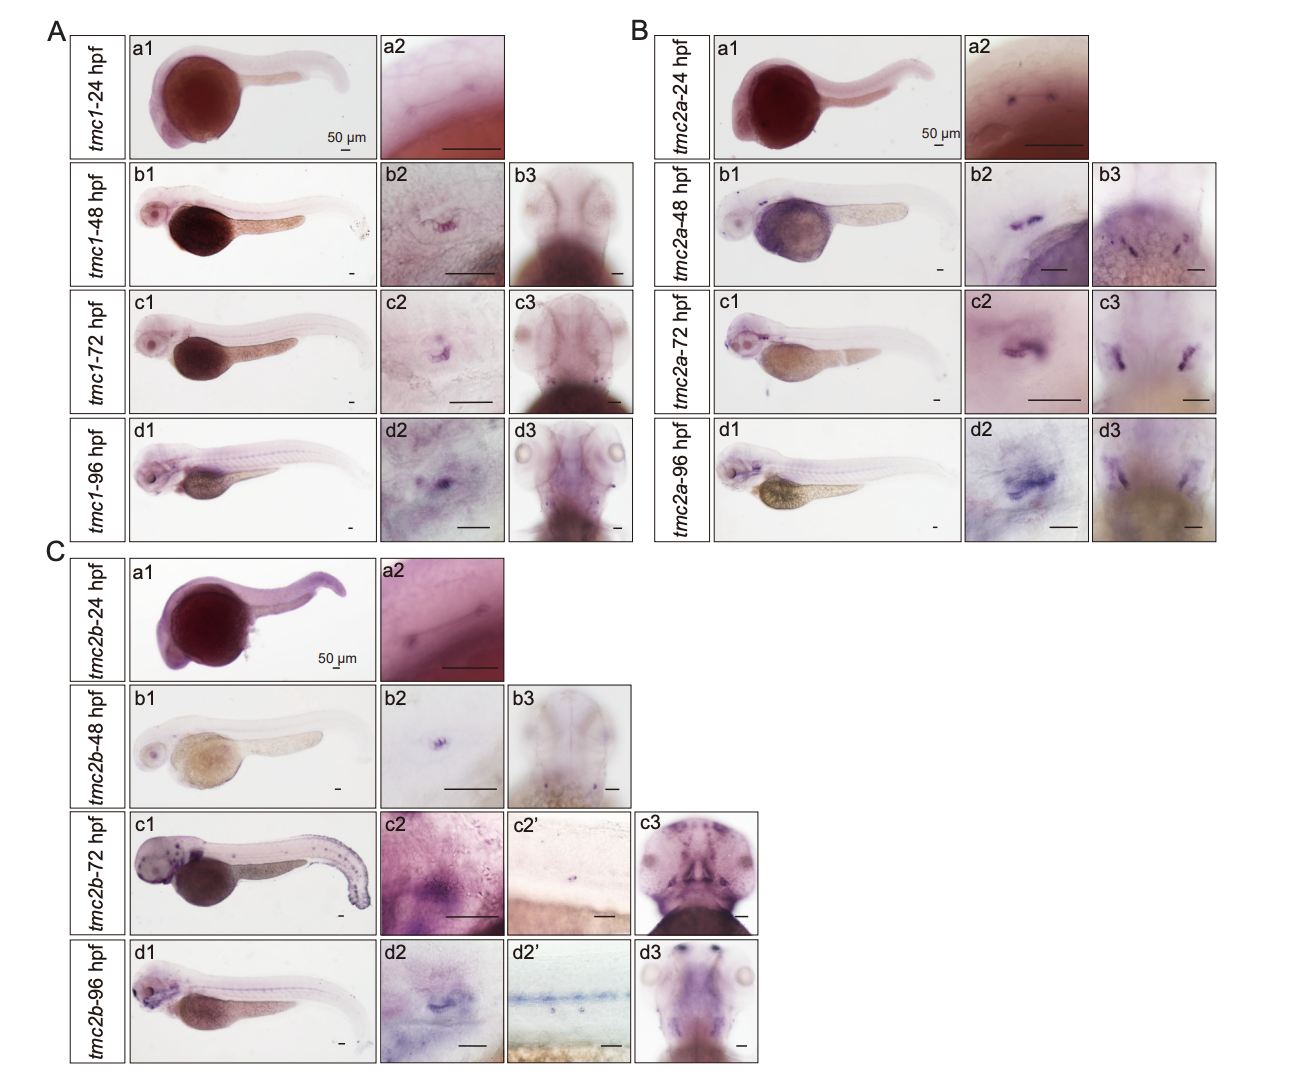
Fig. 3 Expression patterns of zebrafish tmc1, tmc2a, and tmc2b during embryonic development revealed by WISH. (A–C) Panels a1–d1 show lateral views of embryos at 24, 48, 72, and 96 hpf. Panels a2–d2 show higher-magnification views of the otic vesicle. Panels b3–d3 show dorsal views of the head. In C, panels c2′ and d2′ show enlarged views of neuromasts. Scale bars: 50 μm.
Figure Data
Acknowledgments
This image is the copyrighted work of the attributed author or publisher, and
ZFIN has permission only to display this image to its users.
Additional permissions should be obtained from the applicable author or publisher of the image.
Reprinted from Gene expression patterns : GEP, , Geng, K., Wang, X., Wang, X., Liu, D., Qian, F., Expression Analysis of the TMC Gene Family in the Auditory System During Zebrafish Embryonic Development, 119409, Copyright (2026) with permission from Elsevier. Full text @ Gene Expr. Patterns