
Figure 9
- ID
- ZDB-IMAGE-261014-664
- Genes
- Antibodies
- Publication
- Ahmed et al., 2026 - TNFα-dependent modulation of WT1-MMP9 regulatory axis links developmental and inflammatory pathways in glaucoma
- All Figures
- Figures for Ahmed et al., 2026
|
Figure 9
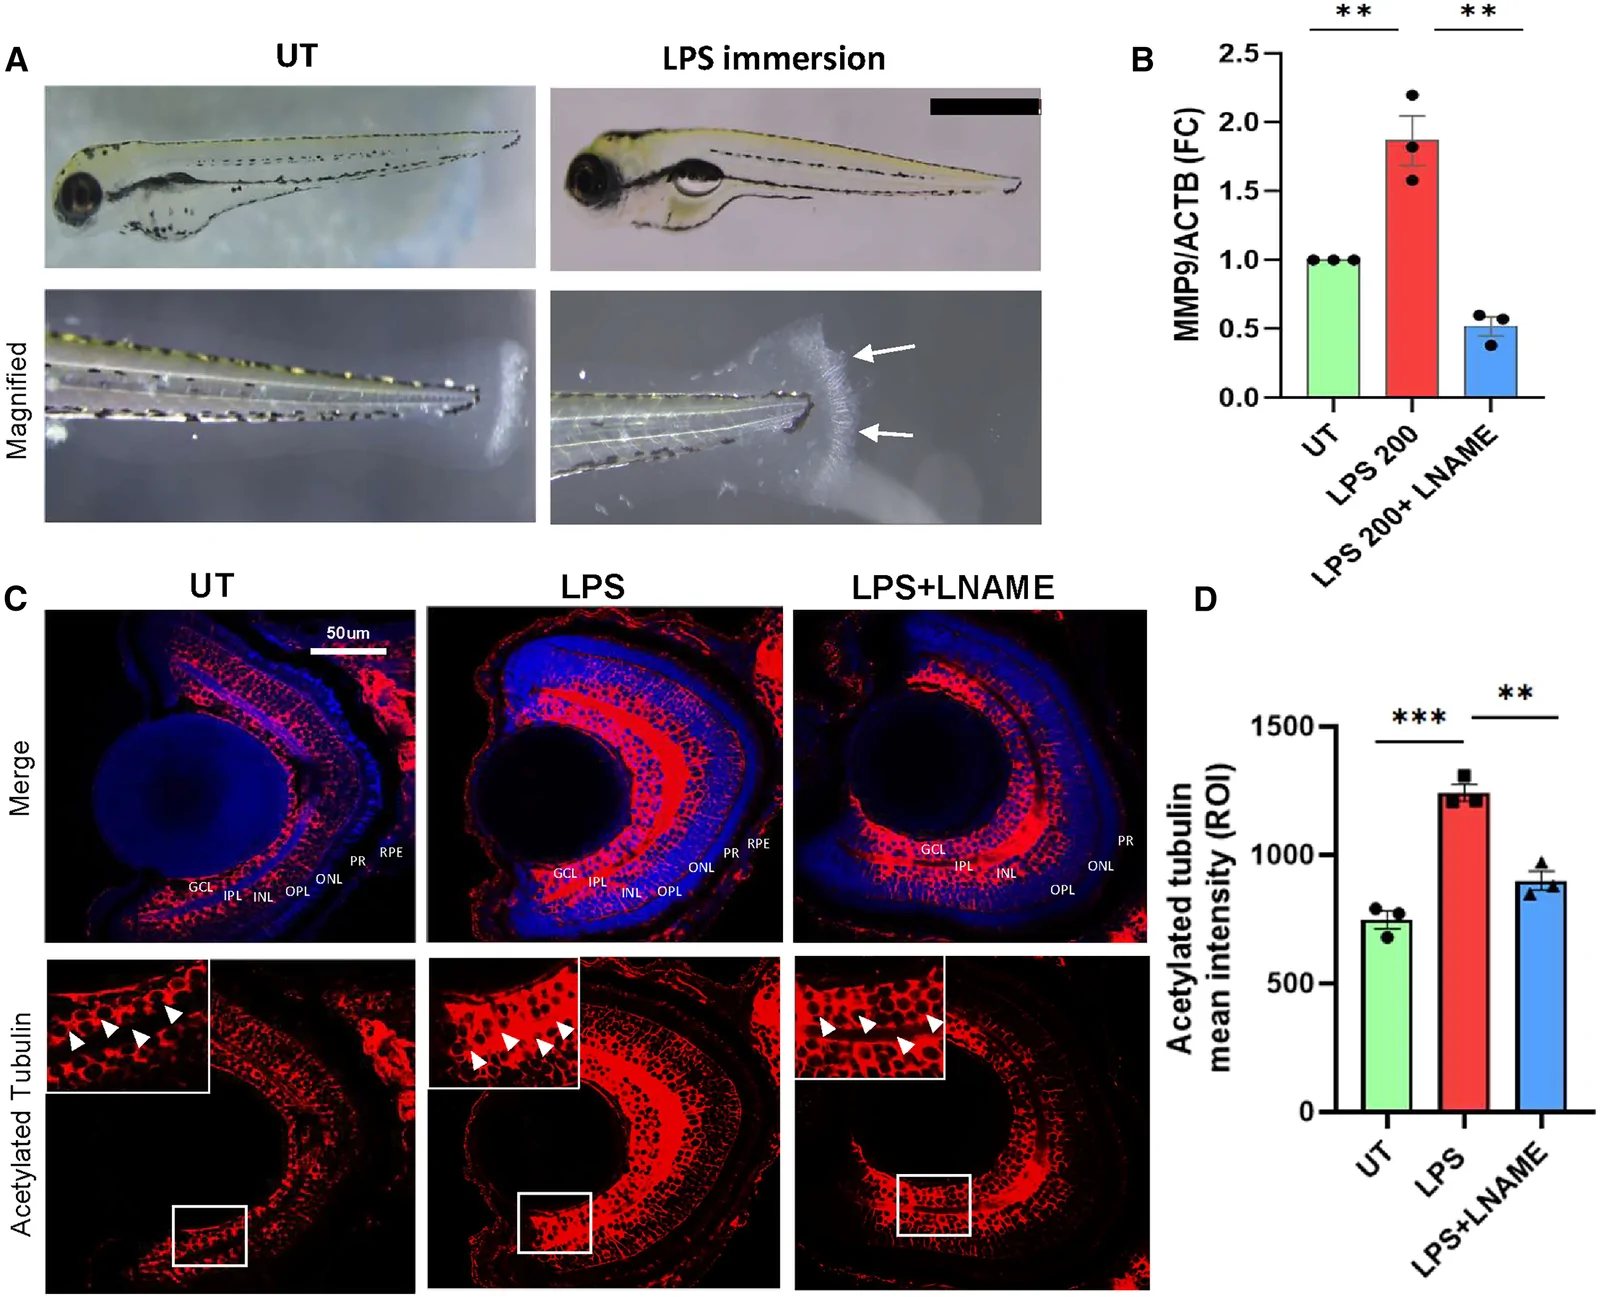
L-NAME pretreatment rescues the LPS mediated upregulation of mmp9 in zebrafish embryos
(A) Gross morphological changes observed in LPS treated zebrafish embryos compared to untreated embryos. The embryos exhibited phenotypes like heart and tail fin edema. Tail fin edema is shown in the lower figure and the white arrows mark the area that shows the phenotype. Scale bar, 500 μm.
(B) qPCR shows L-NAME treatment reducing the LPS induced mmp9 upregulation. Each dot represents an independent biological replicate; N = 3; error bars show mean ± SEM.
(C) Acetylated tubulin staining showing higher intensity in LPS treated sections and relatively reduced intensity LPS+L-NAME treated embryos. The white boxes compare regions in the retinal layers in the three representative images. White arrowheads compare the acetylated tubulin staining in the GCL and IPL layers across the three groups.
(D) Acetylated tubulin ROI mean intensity analysis of the treatment conditions. Each dot represents an independent experiment; error bars show mean ± SEM. Unpaired t test is performed to assess statistical significance; ∗p < 0.05, ∗∗p < 0.01, ∗∗∗p < 0.001 and ∗∗∗∗p < 0.0001. GCL, ganglionic cell layer; IPL, inner plexiform layer; INL, inner nuclear layer; OPL, outer plexiform layer; ONL, outer nuclear layer; PR, photoreceptor layer; RPE, retinal pigmented epithelium.