
- Title
-
CHCHD10P80L knock-in zebrafish display a mild ALS-like phenotype
- Authors
- Légaré, V.P., Harji, Z.A., Rampal, C.J., Antonicka, H., Gurberg, T.J.N., Persia, O., Rodríguez, E.C., Shoubridge, E.A., Armstrong, G.A.B.
- Source
- Full text @ Exp. Neurol.
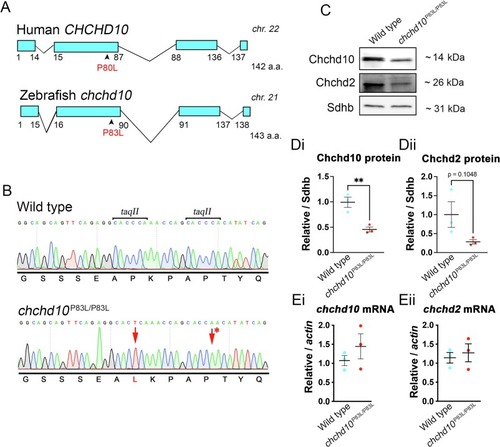
Generation of the chchd10P83L/P83L zebrafish line. A, Human CHCHD10 and zebrafish chchd10 gene structures and location the ALS-associated P80L variant and orthologous P83L variant in our zebrafish mutant. B, Electropherograms of wild type and homozygous chchd10P83L sequences. The asterisk represents a silent mutation included in our donor template for disruption of the two taqII restriction sites. C, Representative immunoblot of Chchd10 and Chchd2 in whole larval lysate from both wild type and chchd10P83L/P83L larvae. Sdhb was used as a loading control and for quantification. Chchd10 protein levels in whole larvae lysate was significantly reduced in our chchd10P83L/P83L model compared to wild type (t (4) = 4.73, p < 0.01) (Di). A tendency for reduced Chchd2 protein concentration was also observed in our mutant model, though this was not found to be significant (t (4) = 2.094, p = 0.10) (n = 3 per genotype, 5 dpf data represent mean ± S.E.M.) (Dii). Ei, Eii, RT-qPCR of the chchd10 and chchd2 transcripts in chchd10P83L/P83L and wild type larvae. No difference was observed in either chchd10 (t (4) = 1.182, p = 0.30) or chchd2 (t (4) = 0.48, p = 0.66) transcript expression levels (n = 3 per genotype, 5 dpf data represent mean ± S.E.M.). |
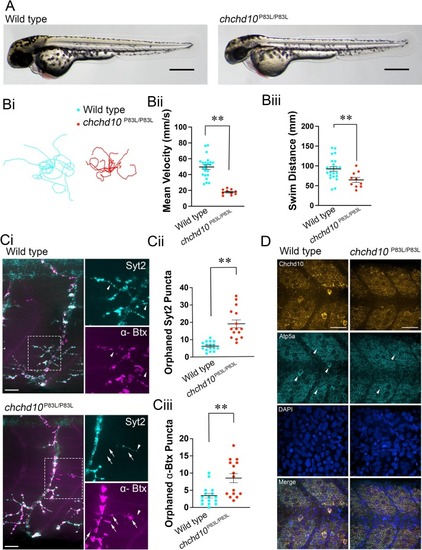
Homozygous chchd10P83L larvae display reduced touch response behaviour, orphaned NMJ pre- and post-synaptic markers and reduced survival. A, Representative images of 56 hpf larvae. Scale bars represent 400 μm. Bi, Ten representative touch-evoked motor response traces superimposed on each other from wild type and chchd10P83L/P83L larvae aged 2 dpf. Bii, Chchd10P83L/P83L swam at a significantly lower mean velocity compared to wild type fish (t (31) = 6.05, p < 0.0001). Mean swim velocity and sample sizes are as follows: wild type (mean = 53.49 mm/s, n = 23), chchd10P83L/P83L (mean = 17.90 mm/s, n = 10). Biii, chchd10 P83L/P83L displayed significantly shorter mean distances compared to wild type larvae (t (31) = 2.84, p < 0.01). Mean swim distance and sample sizes were as follows: wild type (mean = 92.45 mm, n = 23), chchd10 P83L/P83L (mean = 64.66 mm, n = 10). Ci, Representative confocal images of ventral trunk NMJs in larvae aged 2 dpf. NMJ markers are Syt2 (pre-synaptic, cyan) and αBtx (post-synaptic, magenta). Arrowheads and arrows represent orphaned Syt2 and αBtx puncta, respectively. Scale bars represent 40 μm. Cii, Quantification of orphaned pre-synaptic puncta. Larval chchd10 P83L/P83L displayed more orphaned pre-synaptic terminals devoid of post-synaptic labelling when compared to wild type NMJs (t (29) =5.594, p < 0.0001). Data are represented as mean ± S.E.M. Ciii, Quantification of orphaned post-synaptic (αBtx) puncta. Larval chchd10P83L/P83L displayed increased orphaned AChR clusters lacking pre-synaptic Syt2 puncta when compared to wild type NMJs (U = 45.50, p < 0.01). Significance is represented by a double asterisk (p < 0.01). Sample sizes are as follows; wild type n = 16; chchd10P83L/P83L n = 15. D, Representative confocal images of the mitochondrial network in the superficially located slow-twitch muscle cell layer. Markers are Atp5a (mitochondria, cyan), DAPI (nuclei, blue), and Chchd10 (mitochondria, orange). Scale bars represent 70 μm and arrowheads represent mitochondrial networks. (For interpretation of the references to colour in this figure legend, the reader is referred to the web version of this article.) |
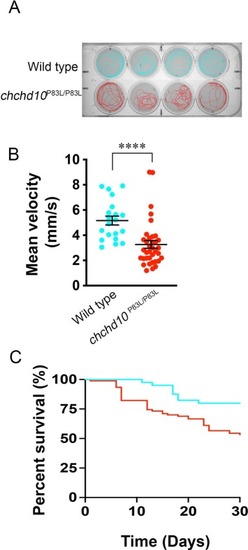
Homozygous chchd10P83L/P83L display reduced motor function and reduced survival compared to wild type larvae. A, Representative individual traces of motor activity of zebrafish larvae aged 5 dpf. B, Quantification of free swim mean velocity: chchd10P83L/P83L = 3.26 mm/s, wild type = 5.16 mm/s (Mann-Whitney, U = 118, p < 0.0001). Sample size (n) are as follows: chchd10P83L/P83L = 36, wild type = 20. Data represented as single data points and mean ± S.E.M. C, Larval chchd10P83L/P83L displayed reduced survival when compared to wild type zebrafish (Log-rank test, Mantel-Cox: χ2 = 7.97, p < 0.01). Sample size (n) are as follows: chchd10 P83L/P83L = 90, wild type = 40. PHENOTYPE:
|
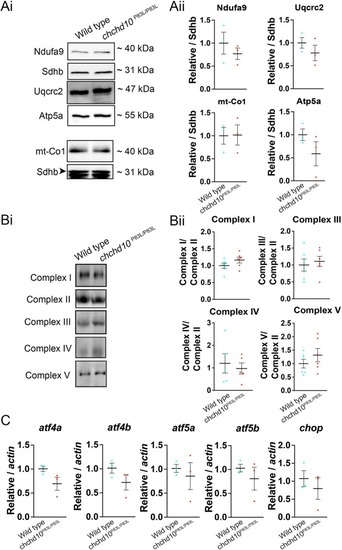
Homozygous chchd10P83L larvae do not display expression or assembly defects of mitochondrial respiratory chain subunit complexes or differences in expression of transcripts involved with the ISR. Ai, Representative immunoblot of mitochondrial respiratory chain subunits in 5 dpf wild type and chchd10P83L/P83L larval lysate. Aii, No significant differences were found between wild type and chchd10P83L/P83L larvae in the expression of any of the respiratory chain subunits: Ndufa9 (t (4) = 0.89, p = 0.44); mt-Co1 (t (4) = 0.006, p = 0.95); Uqcrc2 (t (4) = 1.07, p = 0.35); Atp5a (t (4) = 1.42, p = 0.23). Sdhb was used as loading control. N = 3 per genotype. Bi, Representative Blue Native PAGE in 5 dpf wild type and chchd10P83L/P83L larvae using lysate from one larva in each lane. Bii, No significant differences were found between wild type and chchd10 P83L/P83L larvae in the assembly levels of any of the complexes. Complex I (t (10) = 1.42, p = 0.18); Complex III (t (10) = 0.455, p = 0.66); Complex IV (t (8) = 0.46, p = 0.66); Complex V (t (10) = 1.07, p = 0.31). Sample sizes are n = 6 per genotype, except Complex IV (n = 5 per genotype). C, Transcripts related to the ISR were not significantly altered in chchd10P83L/P83L larvae: atf4a (t (4) = 2.10, p = 0.10); atf4b (t (4) = 1.565, p = 0.19); atf5a (t (4) = 0.5494, p = 0.61); atf5b (t (4) = 0.8625, p = 0.44), and chop (t (4) = 0.745, p = 0.49). (For interpretation of the references to colour in this figure legend, the reader is referred to the web version of this article.) EXPRESSION / LABELING:
|
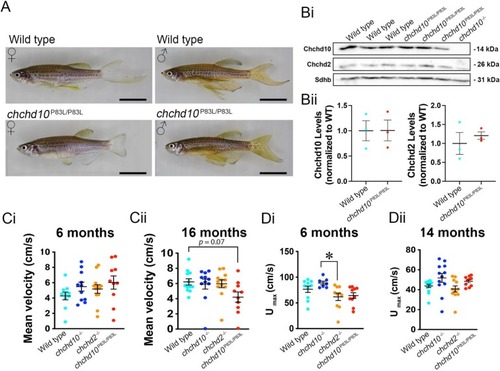
Adult chchd10P83L/P83L zebrafish recover expression of Chchd10 and do not display a significant motor deficit in either a free swim or swim tunnel assay. A, Example images of adult 6-month-old wild type and chchd10P83L/P83L zebrafish. Scale bar represents 1 cm. Bi, Representative immunoblot showing expression of Chchd10 and Chchd2 in whole brain lysate. Bii, Quantification of Chchd10 and Chchd2 levels relative to Sdhb. No differences were found in the expression levels of Chchd10 and Chchd2 between wild type and chchd10P83L/P83L zebrafish brains: Chchd10, (t (4) = 0.02, p = 0.98); Chchd2, (t (4) = 0.67, p = 0.54). Ci, Adult 6-month-old zebrafish were placed into an open field arena and mean swim velocity was measured. No differences in mean free swim velocity were found across all the genotypes (F (3,39) = 1.24, p > 0.05). Mean free swim velocity and sample sizes are as follows: wild type (4.28 cm/s, n = 10); chchd10−/− (5.49 cm/s, n = 11); chchd2−/− (5.18 cm/s, n = 12); chchd10P83L/P83L (6.03 cm/s, n = 12). Cii, Free swim velocity was re-assessed at 16 months of age. No significant differences in mean swim velocity were observed in our fish models though there was a trend of chchd10P83L/P83L zebrafish swimming with a slower mean velocity compared to wild type (Kruskal-Wallis test, H (4) = 7.21, p = 0.07). Measures of mean velocity and sample sizes were as follows: wild type (6.21 cm/s, n = 12); chchd10−/− (5.92 cm/s, n = 11); chchd2−/− (5.97 cm/s, n = 12); and chchd10P83L/P83L (4.21 cm/s, n = 10). Di, Adult zebrafish were placed into a swim tunnel and a sprint swim assay was performed to calculate Umax. A single significant difference was observed of Umax (F (3,33) = 3.73, p = 0.02) between chchd10−/− and chchd2 −/− (p = 0.027) at 6 months of age. Mean Umax and sample sizes were as follows: wild type (76.58 cm/s, n = 10); chchd10−/− (88.69 cm/s, n = 7); chchd2−/− (61.76 cm/s, n = 10); and chchd10P83L/P83L (64.26 cm/s, n = 10). Dii, The sprint swim assay was re-examined at 14 months of age and while a non-parametric ANOVA yield that the data contained significant differences among genotypes (H (4) = 8.76, p = 0.03) a Kruskal-Wallis post-hoc multiple comparisons test was unable to find where the differences lay (p > 0.05). Mean Umax and sample sizes were as follows: wild type (43.81 cm/s, n = 14); chchd10−/− (51.80 cm/s, n = 12); chchd2 −/− (40.68 cm/s, n = 11); and chchd10 P83L/P83L (48.43 cm/s, n = 10). Data is represented as individual measures with mean ± S.E.M. |
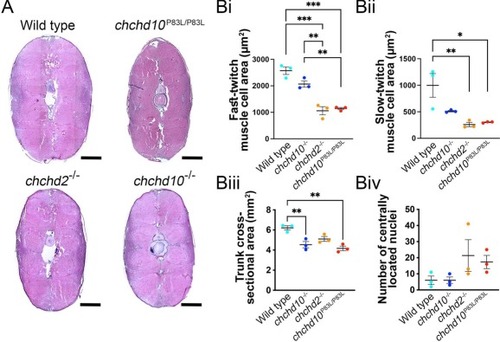
Muscle cells from 11-month old chchd2 −/− and chchd10P83L/P83L zebrafish trunks possessed smaller fast-twitch and slow-twitch cross-sectional areas. A, Representative images of H&E-stained whole trunk cross-sections. Scale bar represents 100 μm. Bi, Quantification of fast-twitch muscle cell cross-sectional area from chchd2 −/− and chchd10P83L/P83L models showed smaller areas when compared to wild type and chchd10 −/− cells (F (3, 8) = 36.01, p < 0.0001). Mean areas and number of Fast-twitch cells counted were as follows: wild type, 2574.2 μm2 (N = 3, n = 208); chchd10 −/−, 2068.0 μm2 (N = 3, n = 192); chchd2 −/−, 1059.4 μm2 (N = 3, n = 240); chchd10P83L/P83L, 1141.0 μm2 (N = 3, n = 173). Double asterisks (p < 0.01) and triple asterisks (p < 0.001) denote statistical significance. Bii, Quantification of slow-twitch muscle cell cross-sectional areas revealed that chchd2 −/− and chchd10P83L/P83L models were smaller when compared to wild type cells (F (3, 8) = 8.87, p < 0.01). Mean area and number of slow-twitch cells counted are as following: wild type, 997.6 μm2 (N = 3, n = 138) chchd10−/−, 511.1 μm2 (N = 3, n = 136); chchd2 −/−, 259.3 μm2 (N = 3, n = 205); chchd10P83L/P83L, 302.4 μm2 (N = 3, n = 144). Single asterisk (p < 0.05) and double asterisks (p < 0.01) denote statistical significance. Biii, Measure of whole trunk cross-sectional area was found to be smaller in chchd10−/− and chchd10P83L/P83L across our genetic groupings (F (3,8) = 12.58, p = 0.002), with the following mean areas: wild type, 6.21 mm2; chchd10 −/−, 4.54 mm2; chchd2 −/−, 5.11 mm2; chchd10 P83L/P83L, 4.17 mm2. Double asterisks (p < 0.01) represent statistical significance. No significant differences were found in our tabulation of centrally located nuclei across our genetic groupings (F (3, 8) = 1.973, p = 0.20, Biv). PHENOTYPE:
|
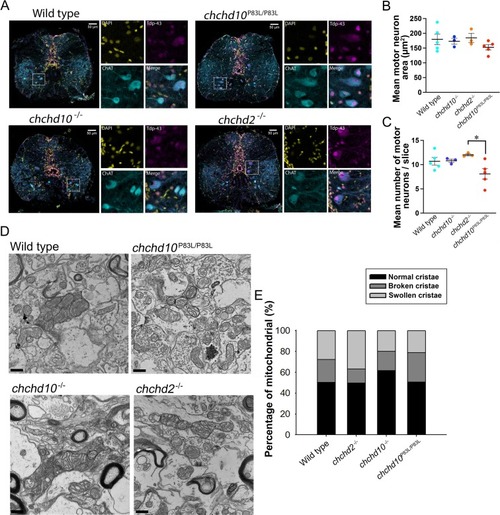
A, Representative images of 11-month-old zebrafish motor neurons from rostral sections of the spinal cord labelled with DAPI (yellow), ChAT (cyan) and TDP-43 (magenta). Scale bar represents 50 μm. Insets show images of areas denoted by the white boxes. B, Motor neuron area was not found to be different in spinal cords from chchd10P83L/P83L, chchd10−/−, chchd2−/−, models when compared to wild type zebrafish motor neurons (F (3,12) = 1.035, p = 0.412). C, The number of spinal cord motoneurons was found to be statistically different across our genetic groups (F (3,12) = 3.767, p = 0.04), with the only difference occurring between the chchd2−/− and chchd10P83L/P83L. There was a trend of chchd10P83L/P83L spinal cord sections possessing fewer motor neurons when compared to wild type spinal cords but this was not found to be significant (p = 0.14). Sample sizes were N = 3–5 fish per genotype and number of motor neurons measured were: wild type, n = 805; chchd10P83L/P83L, n = 484; chchd10−/−, n = 486; chchd2−/−, n = 541. Data represented as mean ± S.E.M. Single asterisk represents (p < 0.05). No obvious changes in Tdp-43 localization were observed among our models. D, Example electron micrographs showing mitochondria in spinal cord neurons. Scale bar represents 200 nm. E, Percentage of mitochondria with normal, broken and swollen cristae in SC cells. (For interpretation of the references to colour in this figure legend, the reader is referred to the web version of this article.) PHENOTYPE:
|
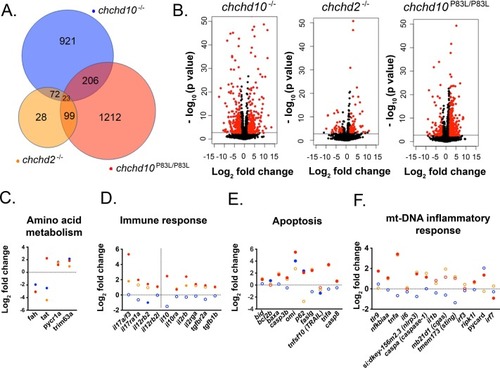
RNA sequencing results of 7-month-old adult chchd10−/−, chchd2−/−, and chchd10P83L/P83L spinal cords compared to RNA from wild type spinal cords. A, Number of shared and total significantly altered transcripts (p > 0.05) compared to transcripts in spinal cords from wild type zebrafish. B, Volcano plots showing differentially expressed transcripts with their Log2 fold change. Significantly altered transcripts (p > 0.05) are represented in red and transcripts not found to be significantly altered are labelled in black. Transcripts involved different cellular pathways found to be significantly altered including amino acid metabolism (C), immune response (D), apoptosis (E), and mt-DNA inflammatory response (F). Data presented in C–F are Log2 fold change compared to transcripts derived from wild type spinal cords. Blue dots represent chchd10−/− transcripts, orange dots represent chchd2−/− transcripts, and red dots represent chchd10P83L/P83L transcripts. Filled dots represent significant changes (p < 0.05), and empty dots represent transcript expression levels that are not significantly different when compared to transcripts derived from wild type spinal cords (p > 0.05). (For interpretation of the references to colour in this figure legend, the reader is referred to the web version of this article.) |